RTL-SDR and GNU Radio 完善的资料汇总
http://superkuh.com/rtlsdr.html
Page Sections
RTL-SDR and GNU Radio with Realtek RTL2832U [Elonics E4000/Raphael Micro R820T] software defined radio receiver.
 Originally meant for television reception the discovery of the debug/raw mode was perhaps first noticed by Eric Fry in March of 2010 and then expanded upon and implemented by Antti Palosaari in Feb 2012 who found that these devices can output unsigned 8bit I/Q samples at high rates. Or not. Who knows? A lot of people other people have helped build it up from there.
For the best information stop reading this page right now and go to the rtl-sdr wiki - OsmoSDR by the Osmocom people who created,
Originally meant for television reception the discovery of the debug/raw mode was perhaps first noticed by Eric Fry in March of 2010 and then expanded upon and implemented by Antti Palosaari in Feb 2012 who found that these devices can output unsigned 8bit I/Q samples at high rates. Or not. Who knows? A lot of people other people have helped build it up from there.
For the best information stop reading this page right now and go to the rtl-sdr wiki - OsmoSDR by the Osmocom people who created,
- librtlsdr - contains the major part of the driver
- rtl_sdr, rtl_tcp, rtl_test, etc - command line capture tools and utilities
- gr-osmosdr - gnuradio compatible module
- and a bunch of other stuff.
 In order to do this the rtlsdr dongles use a phased locked loop based synthesizer to produce the local oscillator required by the quadrature mixer. The quadrature mixer produces a complex-baseband output where the signal spans from -bandwidth/2 to +bandwidth/2 and bandwidth is the analog bandwidth of the mixer output stages. (Datasheets, general ref:Quadrature Signals: Complex, But Not Complicated by Richard Lyons) This is complex-sampled (I and Q) by the ADC. The ADC samples at 28.8Msps, and the results are resampled inside the RTL2832U to present whatever sample rate is desired to the host PC. This can be 3.2 MS/s but 2.4 MS/s is the max recommended to avoid losing samples. The actual output is interleaved; so one byte I, then one byte Q with no header or metadata (timestamps). The samples themselves are unsigned and you subtract 127 from them to get their actual {-127,+127} value. You'll almost certainly notice a stable spike around DC. If all I and Q samples from a spectrum are averaged the result from each should be 0. To remove the bias measure it empirically then add that constant to the 127 you normally subtract. If it is 0.39, then subtract 127.39.
Do not use the dvb drivers on the CD or your OS. Those are for the dvb mode and not the debug mode that outputs raw samples. Linux 3.x kernel should check with "$ lsmod dvb_usb_rtl28xxu" and if found at least "$ sudo modprobe -r dvb_usb_rtl28xxu" to unload it. Be careful about gnuradio-3.7 installs that may leave behind problem files.
SDR# is probably the best application to start out with but you'll have to compile from svn for linux+mono because of some non-portable mono ifdef's during building. Alternately, try Gqrx 2.2.0 which has Linux and OS X native binaries packages with all dependencies (ie, gnuradio) included! multimode has a very full and configurable GUI. It is my favorite for linux if GNU Radio is installed. For low cpu power and low ram devices try rtl_fm. On that note stevemprovides rtlsdr and related tools for openwrt and others made various cell phone ports.
https://sdr.osmocom.org/trac/wiki/rtl-sdr#KnownApps and https://sdr.osmocom.org/trac/wiki/GrOsmoSDR#KnownApps have the best lists of available applications.
In order to do this the rtlsdr dongles use a phased locked loop based synthesizer to produce the local oscillator required by the quadrature mixer. The quadrature mixer produces a complex-baseband output where the signal spans from -bandwidth/2 to +bandwidth/2 and bandwidth is the analog bandwidth of the mixer output stages. (Datasheets, general ref:Quadrature Signals: Complex, But Not Complicated by Richard Lyons) This is complex-sampled (I and Q) by the ADC. The ADC samples at 28.8Msps, and the results are resampled inside the RTL2832U to present whatever sample rate is desired to the host PC. This can be 3.2 MS/s but 2.4 MS/s is the max recommended to avoid losing samples. The actual output is interleaved; so one byte I, then one byte Q with no header or metadata (timestamps). The samples themselves are unsigned and you subtract 127 from them to get their actual {-127,+127} value. You'll almost certainly notice a stable spike around DC. If all I and Q samples from a spectrum are averaged the result from each should be 0. To remove the bias measure it empirically then add that constant to the 127 you normally subtract. If it is 0.39, then subtract 127.39.
Do not use the dvb drivers on the CD or your OS. Those are for the dvb mode and not the debug mode that outputs raw samples. Linux 3.x kernel should check with "$ lsmod dvb_usb_rtl28xxu" and if found at least "$ sudo modprobe -r dvb_usb_rtl28xxu" to unload it. Be careful about gnuradio-3.7 installs that may leave behind problem files.
SDR# is probably the best application to start out with but you'll have to compile from svn for linux+mono because of some non-portable mono ifdef's during building. Alternately, try Gqrx 2.2.0 which has Linux and OS X native binaries packages with all dependencies (ie, gnuradio) included! multimode has a very full and configurable GUI. It is my favorite for linux if GNU Radio is installed. For low cpu power and low ram devices try rtl_fm. On that note stevemprovides rtlsdr and related tools for openwrt and others made various cell phone ports.
https://sdr.osmocom.org/trac/wiki/rtl-sdr#KnownApps and https://sdr.osmocom.org/trac/wiki/GrOsmoSDR#KnownApps have the best lists of available applications.
This page is mostly just notes to myself on how to use rtlsdr's core applications, 3rd party stuff using librtlsdr and wrappers for it, and lots on using the gr-osmosdr source in GNU Radio and GNU Radio Companion. This isn't a "blog", don't read it sequentially, just search for terms of interest or use the topics menu. For realtime support on the same topics try Freenode IRC's ##rtlsdr and reddit's r/rtlsdr.
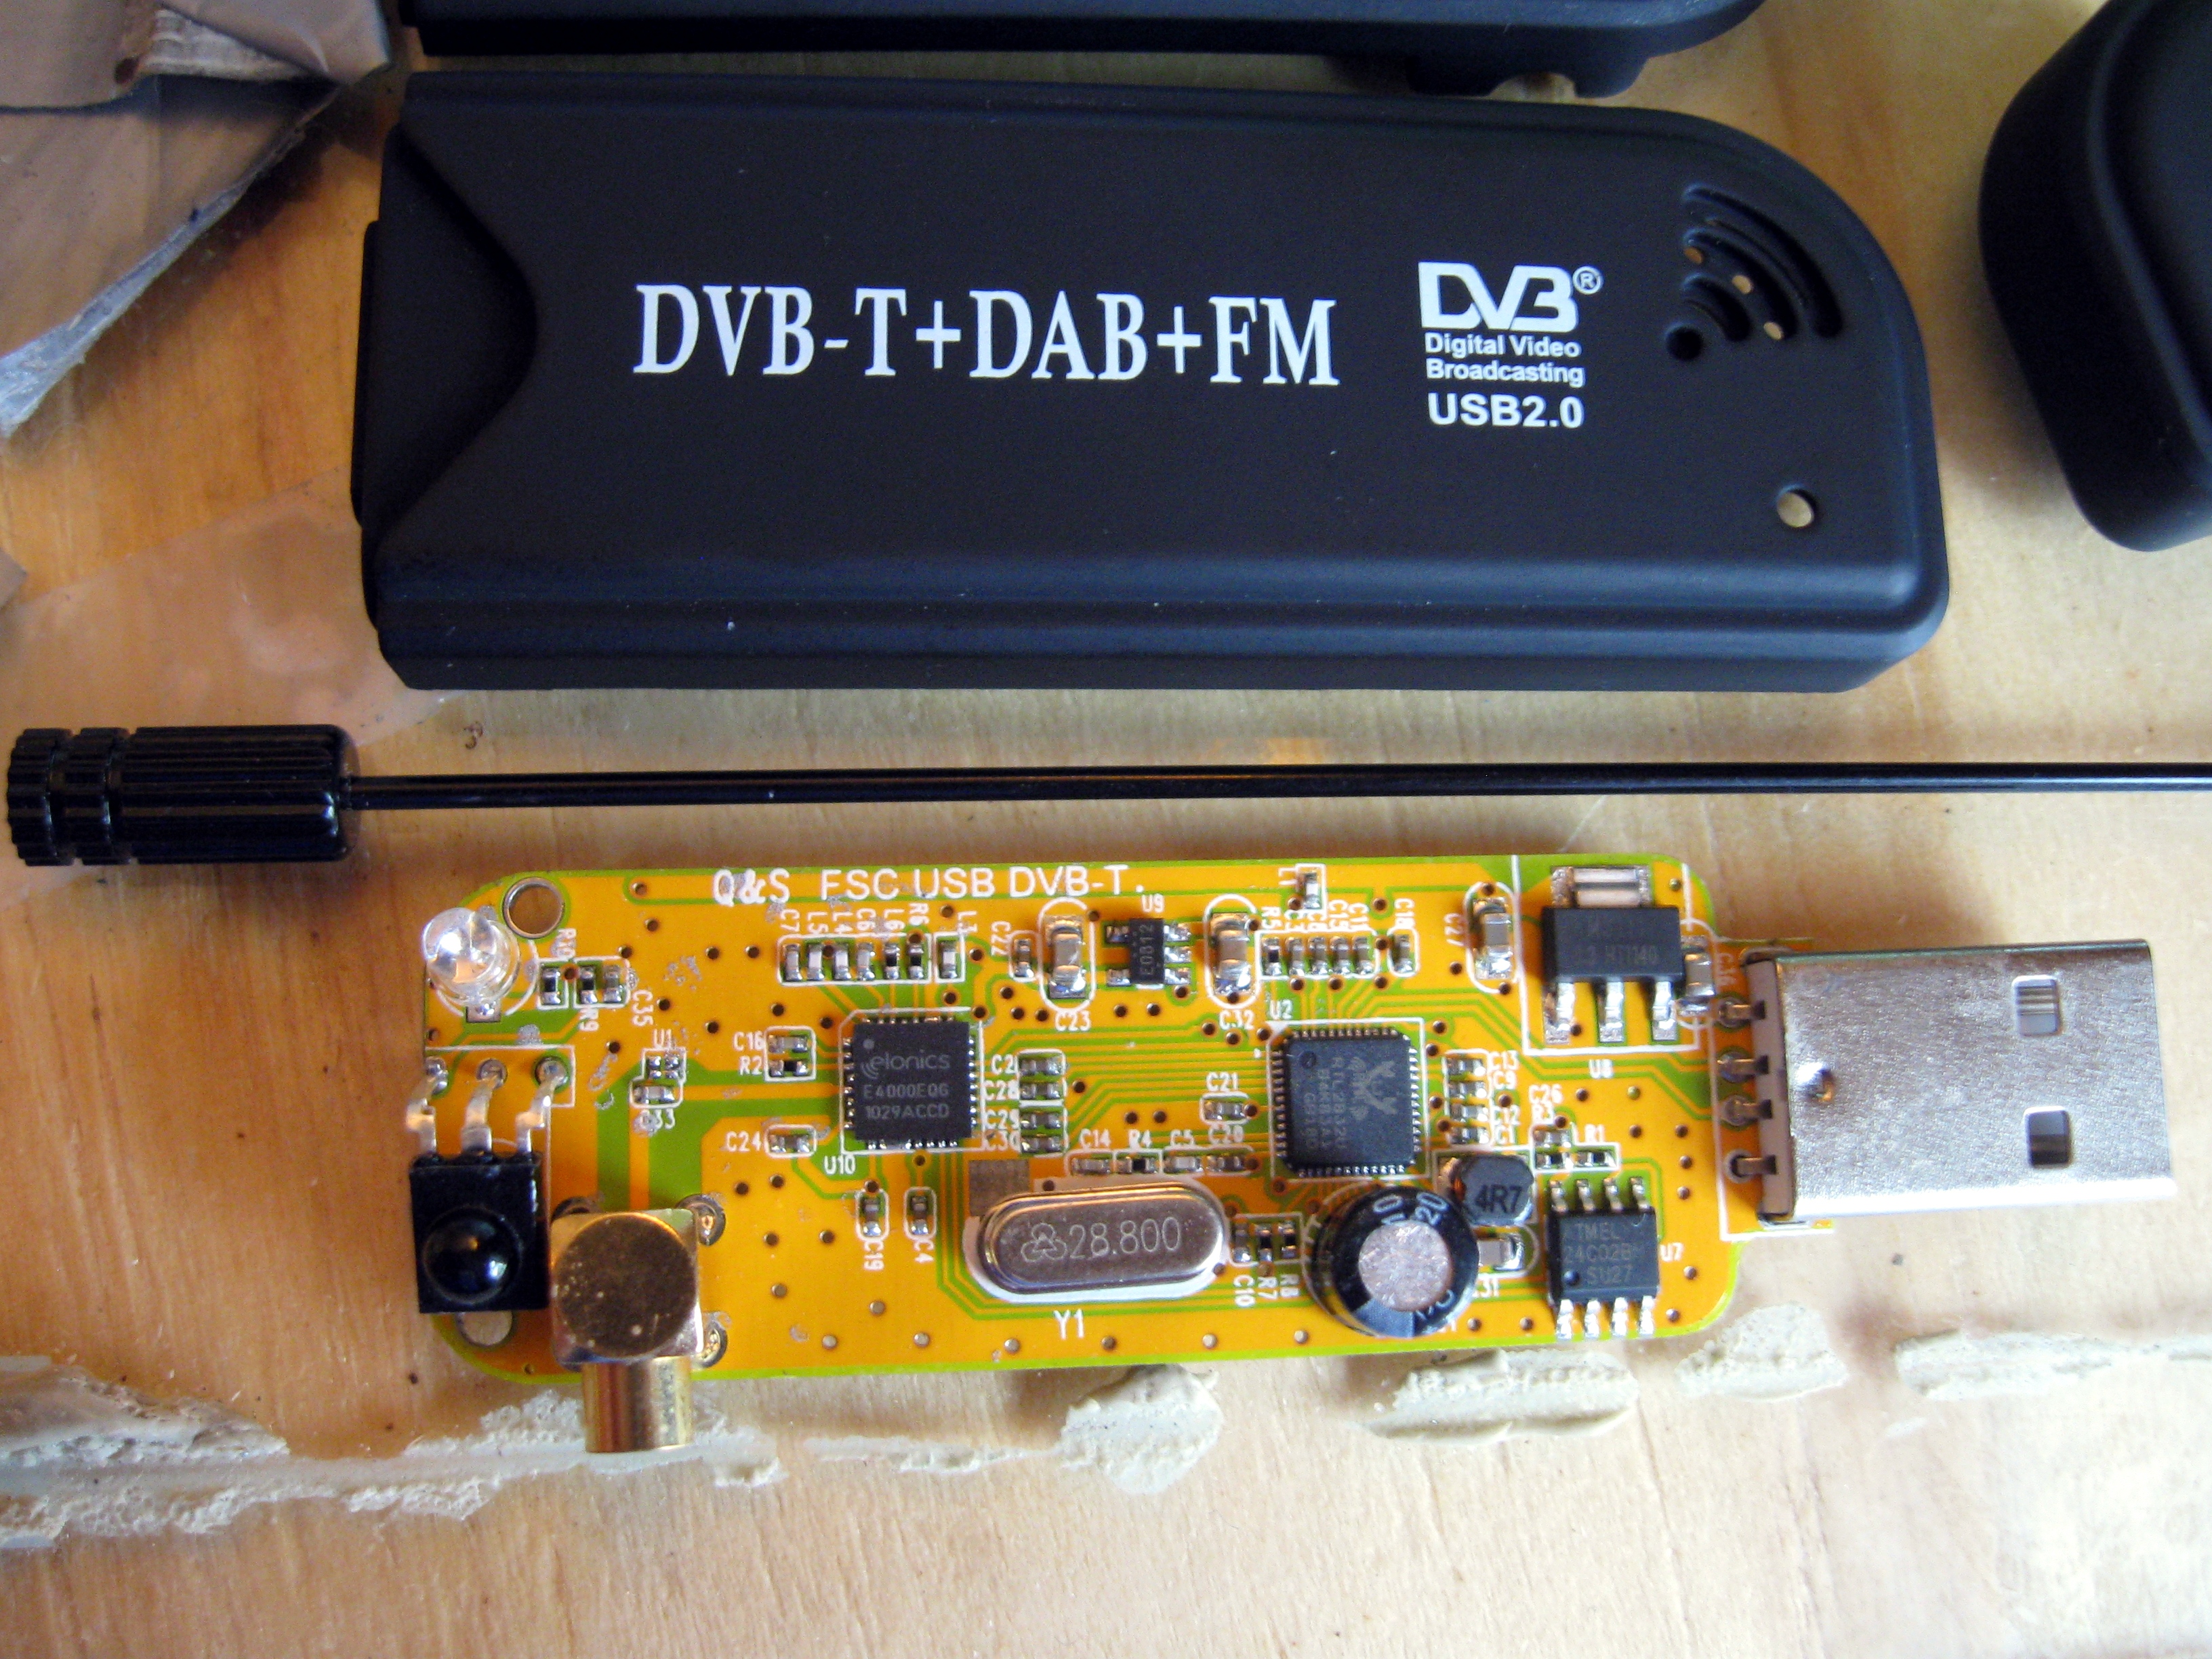
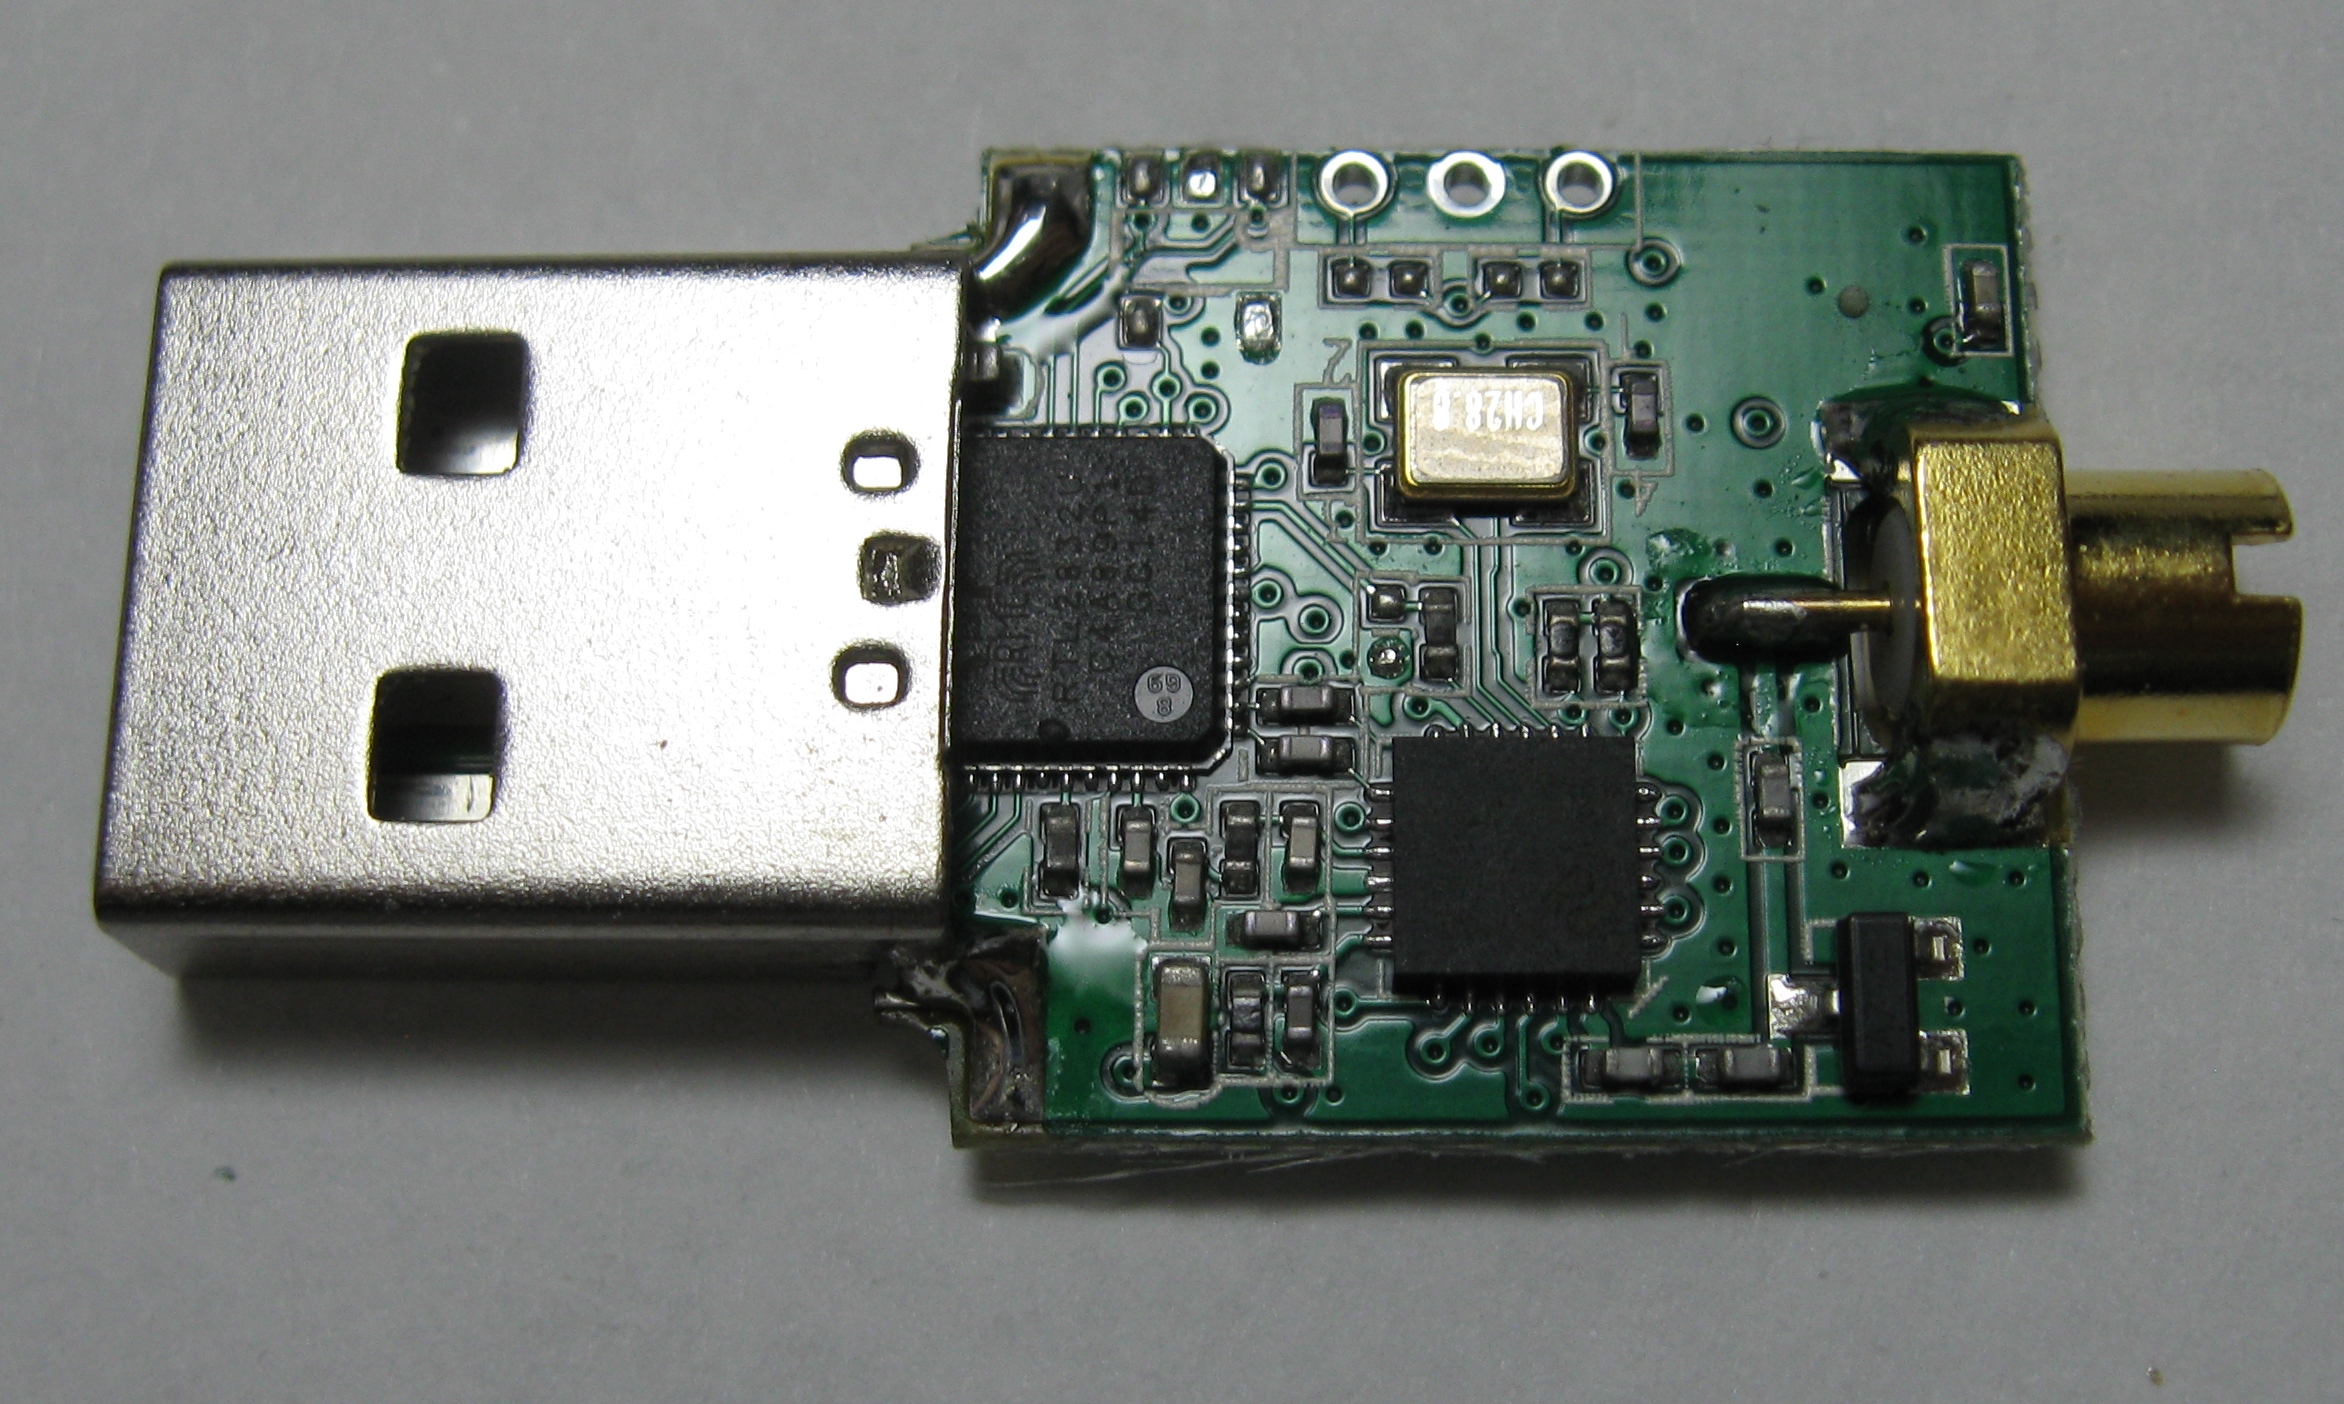 I bought two E4000 based rtlsdr usb dongles for $20 each in early 2012. Then many months later I bought two more R820T tuner based dongles for ~$11 each. There's photos of the E4ks up at the top of the page and of an R820T based dongle in the "mini" format off to the left. It and the Newsky E4k dongle up top are MCX. Some of the cheaper dongles occasionally miss protection diodes but the last three I've bought have been fine. The antenna connector on the E4k ezcap up top is IEC-169-2, Belling-Lee. I usually replace it with an F-connector or use a PAL Male to F-Connector Female. F to MCX for the other style dongles.
Tuners
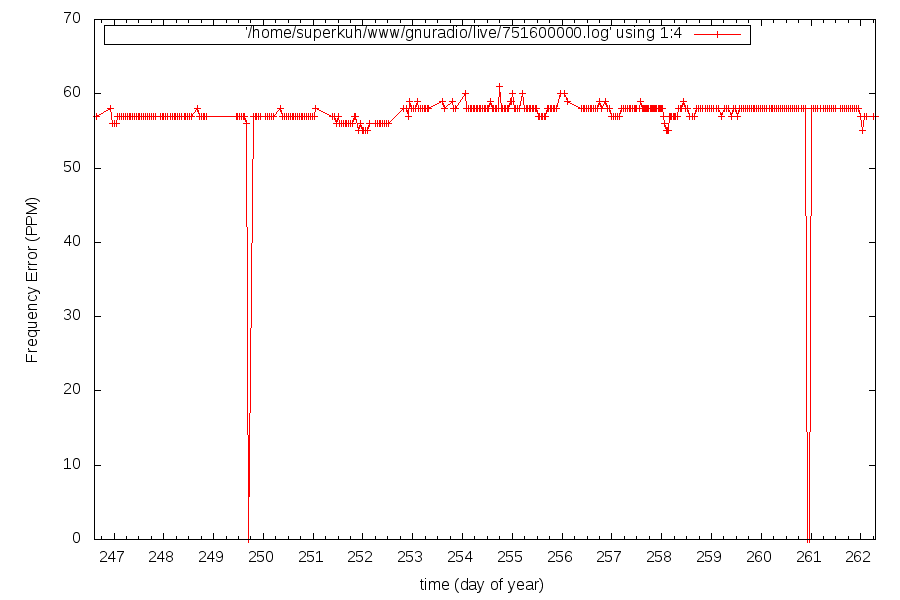
Only two tuners are very desirable at this time. The Elonics E4000 and the Raphael Micro R820T. In general they are of equal performance but the sticks with R820T chips are much easier to find, cheaper (~$12 USD), and they have a smaller DC spike due to the use of a non-zero intermediate frequency. The E4K is better for high end (>1.7GHz) while the R820T can tune down to 24 Mhz without any mods. E4000 tuners used to re-tune twice as fast as R802T tuners, but this was fixed in keenerd's experimental fast-r820t branchwhere R820T actually tune a tiny bit faster than the E4Ks. These changes were later adopted by the main rtlsdr. Antti Palosaari's measurements show the R820T use ~300mA of 5v USB power while the E4000 devices use only ~170mA. In late 2013 Astrometra DVB-T2 dongles with the R828D tuner (pic) paired RTL2832U have begun to appear (2). The DVB-T2 stuff is done by a separate Panasonic chip on the same I2C bus. merbanan wrote a set of patches, rtl-astrometa, for librtlsdr has better support these tuners. The performance hasn't been characterized but it at least works for broadcast wide FM via SDR. Steve M's preliminary testing suggests bad performance in the form of fixed spurs 25 dB above noise floor in the IF at approximately 196 and -820 KHz. He was able to mitigate these with the hardware mod of removing the crystal for the DVB chip. Official support was added to the rtl-sdr on Nov 5th while testing support was added on Nov 4th. All of the dongles have significant frequency offsets from reality that can be measured and corrected at runtime. My ezcap with E4000 tuner has a frequency offset of about ~44 Khz or ~57 PPM from reality as determined by checking against a local 751 Mhz LTE cell using LTE Cell Scanner. Here's a plot of frequency offsets in PPM over a week. The major component of variation in time is ambient temperature. With the R820T tuner dongle after correctly for I have has a ~-17 Khz offset at GSM frequencies or -35 ppm absolute after applying a 50 ppm initial error correction. When using kalibrate if the initial frequency error too large the FCCH peak might be outside the bandwidth. This would require passing an initial ppm error parameter (from LTE scanner) -e . Another tool for checking frequency corrections iskeenerd's version of rtl_test which uses (I think) ntp and system clock to estimate it rather than cell phone basestation broadcasts. Also very cool is the MIT Haystack people switching to rtlsdr dongles (pdf) for their SRT and VSRT telescope designs,Use of DVB-T RTL2832U dongle with Rafael R820T tuner (pdf). The first of these characterizes the drift of the R820T clock and gain over time as well as a calibration routine. Very useful stuff. 2012-08-22: The E4000 tuner datasheet has been released into the wild. Elonics-E4000-Low-Power-CMOS-Multi-Band-Tunner-Datasheet.pdf, but... "All the ones that are documented in the DS are 'explained'in the driver header file ... And the rest, the datasheet call them "Ctrl2: Write 0x20 there" and no more details" 2012-09-07: Experimental support for dongles with the Rafael Micro R820T tuner that started appearing in May has beenadded to rtl-sdr source base by stevem. These tuners cover 24 MHz to 1766 MHz. They also don't have the DC spike caused by the I/Q imbalance since they use a different, non-zero, IF. On the other hand, they might have image aliasing due to being superheterodine receivers. See stevem's tuner comparisons. On 2012-09-20 the R820T datasheet was leaked to the ultra-cheap-sdr mailing list. The official range is 42-1002 Mhz with a 3.5 dB noise figure. On 2012-10-04 my order arrived. I'm liking this tuner very much since it actually works well, locking down to 24 Mhz or so *without* direct sampling mode. Here's a rough gnuplot spectral map of 24 to 1700 Mhz over 3 days I made with some custom perl and python scripts. Don't judge the r820t on the quality of that graph, it is just to show the range. You can see where the front-end gets massively overloaded by pager transmissions which then appear broadly stretched over the high frequencies. I do almost no processing of the signal (ie, no IQ correction), don't clear the buffer between samples (LSB probably bad), and use a hacky way to display timeseries data in gluplot. Real SDR software like SDR# shows them to be equal in quality to E4ks. stevem did gain measurement tests with a few dongles using some equipment he had to transmit a GSM FCCH peak, "which is a pure tone." This includes the E4000 and R820T tuners. In addition he measured the mixer, IF and LNA for the R820T.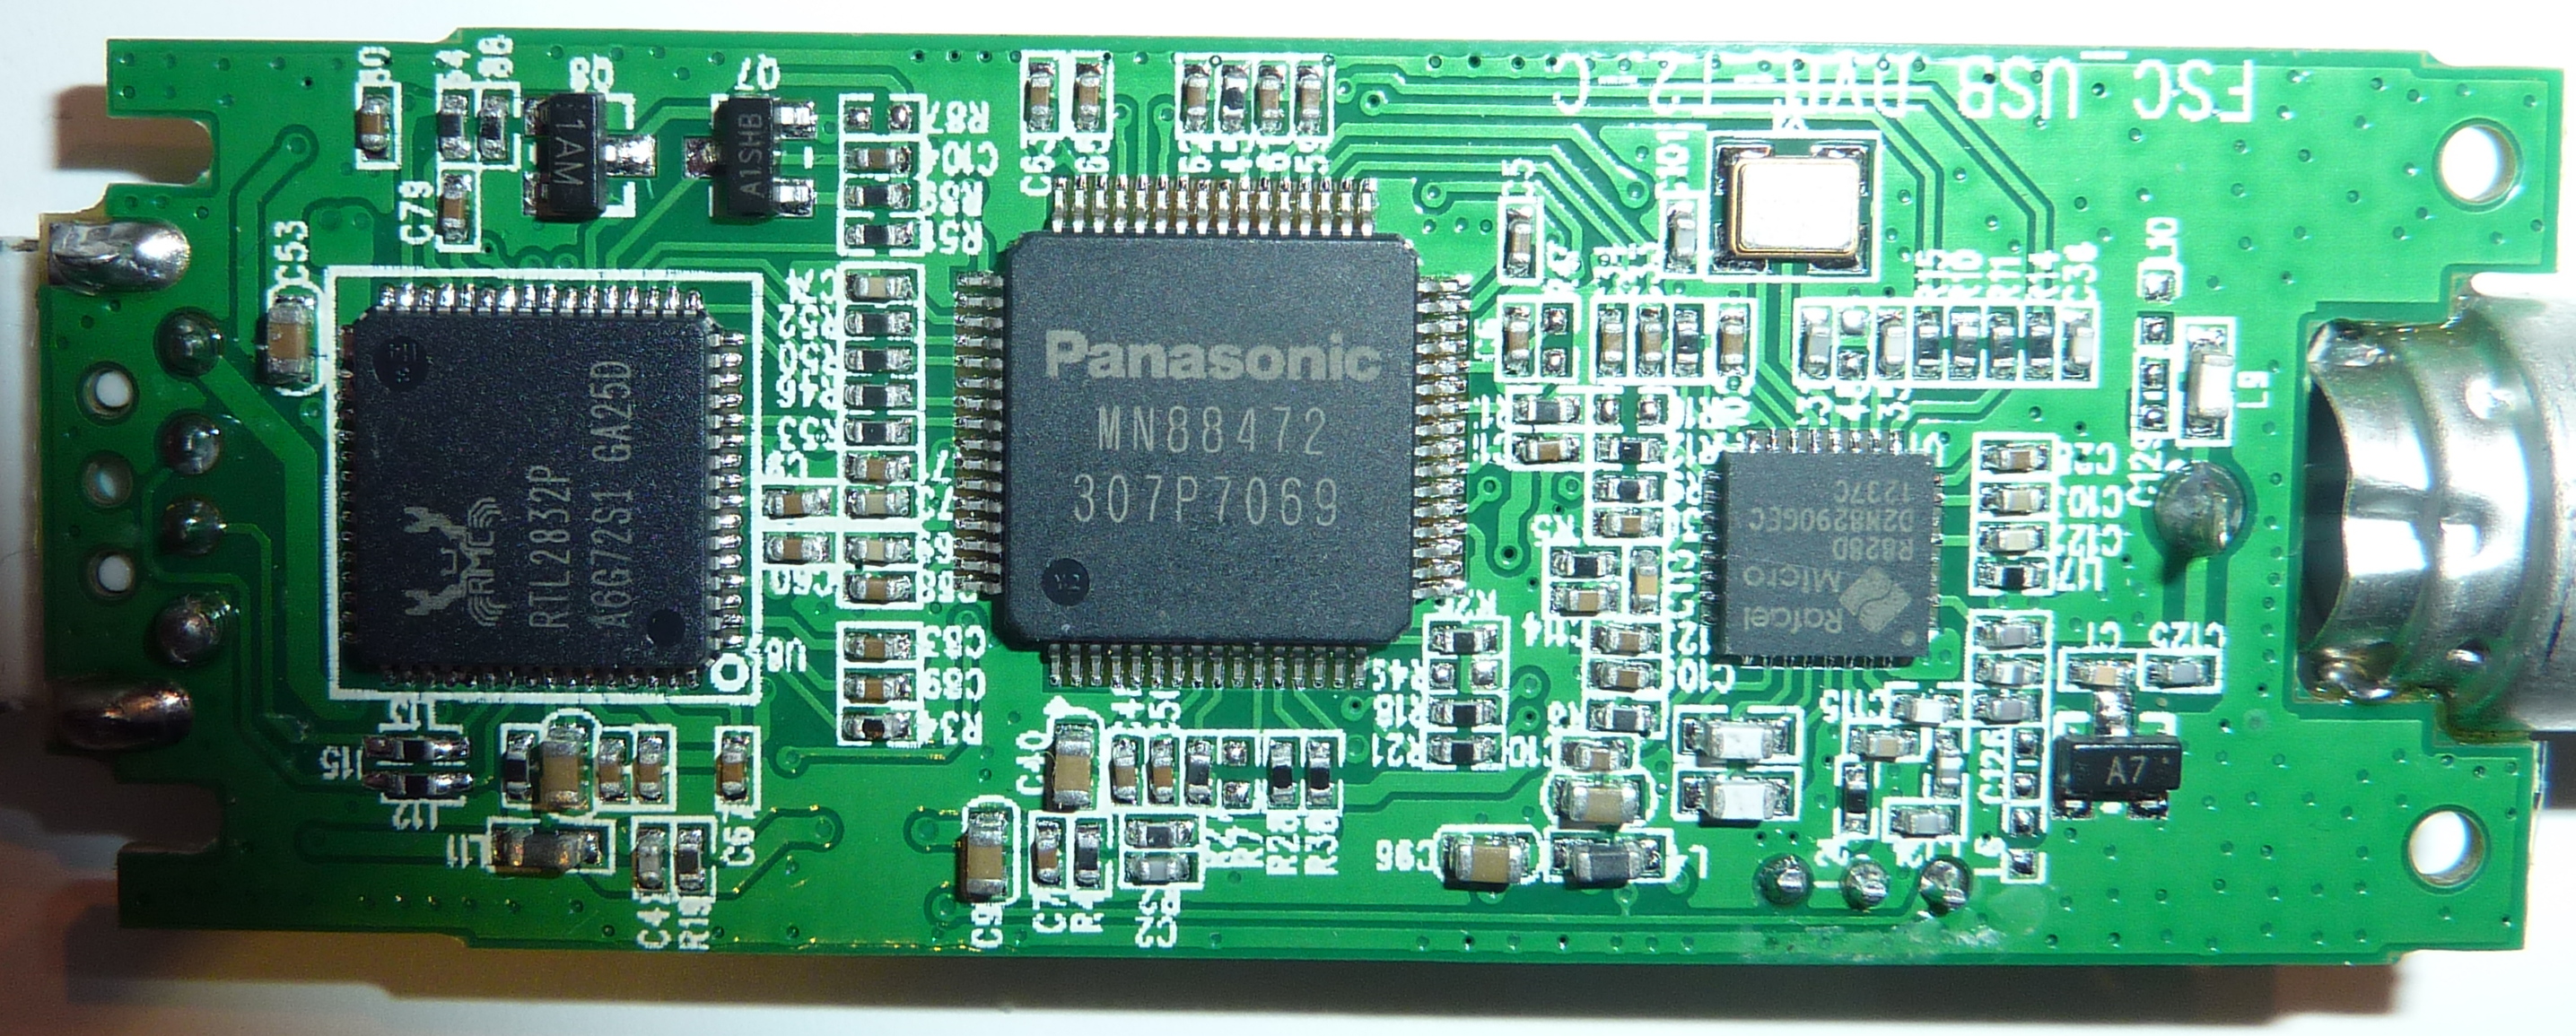
High Frequency (0-30Mhz) Direct Sampling Mod
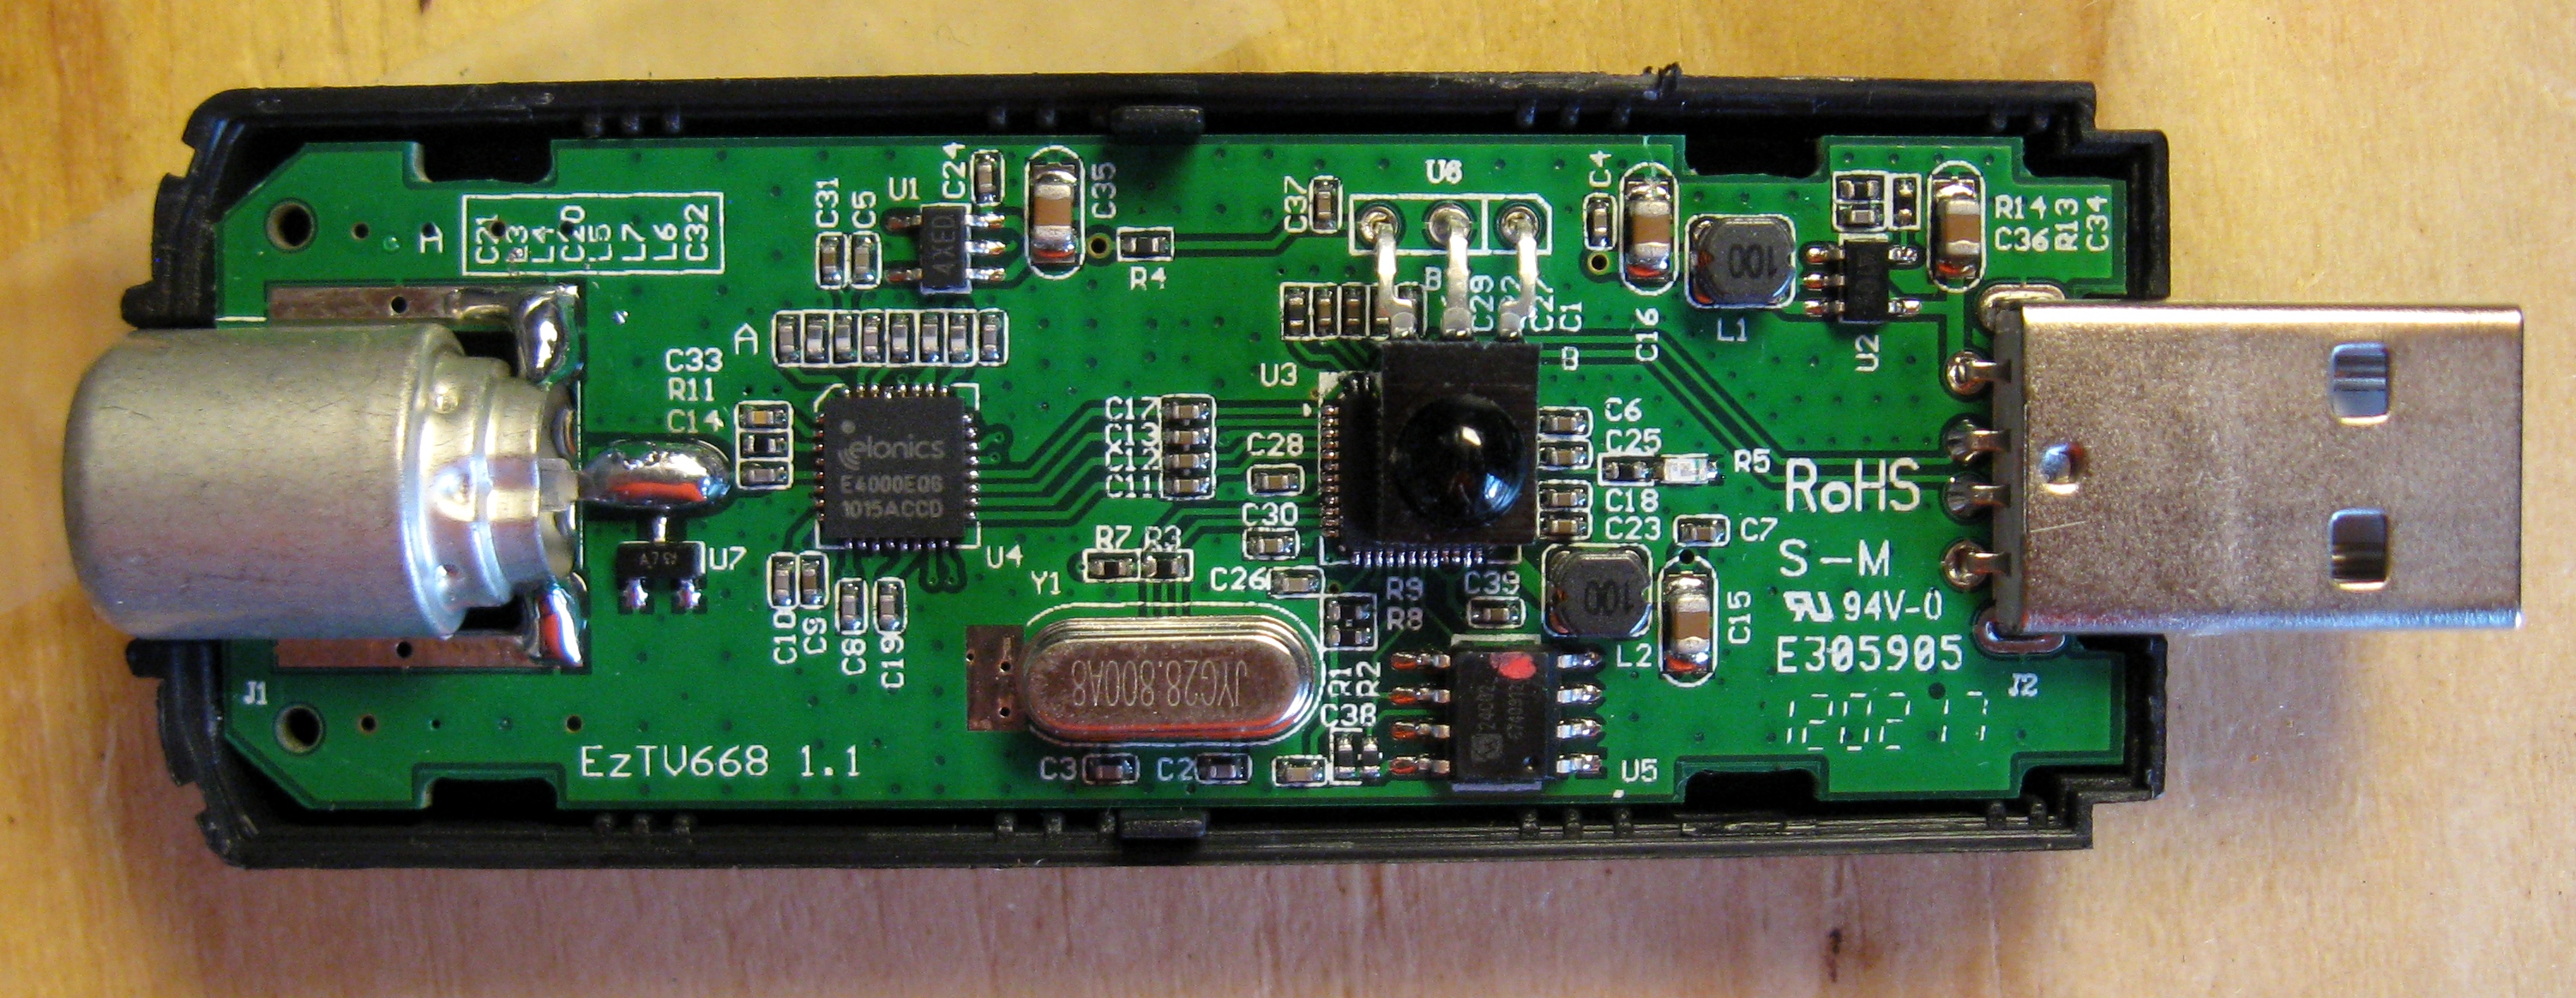
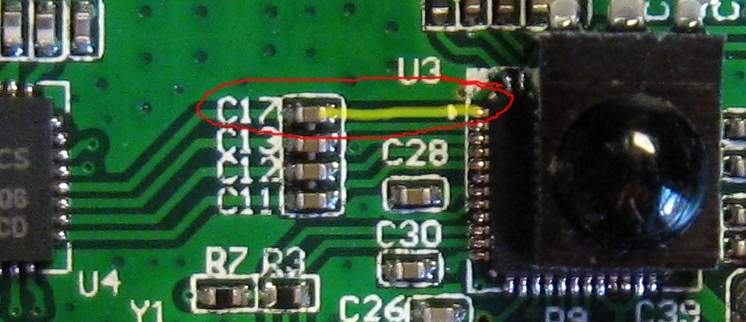 Steve Markgraf of Osmocom has created an experimental software and hardware modification to receive 0~30Mhz(*) by using the 28.8 MHz RTL2832U ADCs for RF sampling and aliasing to do the conversion. In practice you only get DC-14.4MHz in the first Nyquist zone but the upper could be had by using a 14.4 MHz to 28.8 MHz bandpass filter. In the stereotypical ezcap boards you can test this by connecting an appropriately long wire antenna to the right side of capacitor 17 (on EzTV668 1.1, at least) that goes to pin 1 of the RTL2832U. That's the one by the dot on the chip surface. Apparently even pressing a wet finger onto the capacitor can pick up strong AM stations. This bypasses static protection among other things so there's a chance of destroying your dongle. For gr-osmosdr the parameter direct_samp=1 or direct_samp=2 gives you the two I or two Q inputs.
Differential input
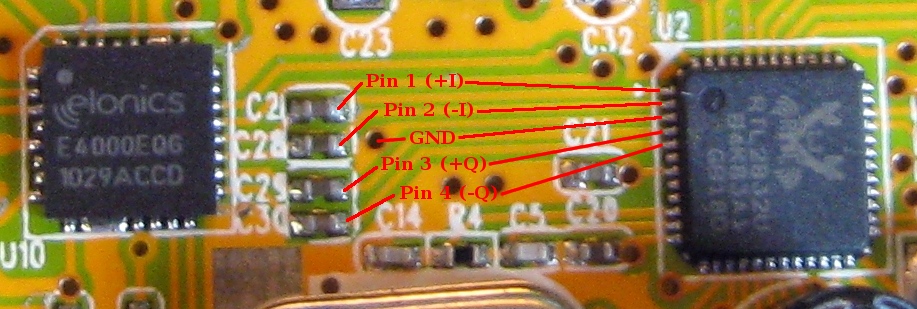
 I've been told my pin numbering doesn't correspond to the datasheets, so take that with salt. The relative positions are correct regardless of the numbering.
Since then the direct sampling branch has been integrated into main and a number of people have also done balun stuff to use both RTL2832U ADC inputs (usually the two I) in direct sampling mode. Dekar has a page showing how to use an ADSL transformer to generate signal for the ADCs differential input using pin 1 (+I) and 2(-I) on the RTL2832. mikig has a useful pdf schematic with part numbers for using wide band transformers or toroids for winding your own. Here's a series of posts from bh5ea20tb showing how to use a FT37-43 ferrite core. And another example from IW6OVD Fernando. PY4ZBZ as well. The ADC has a differential/balanced input so this is done mainly for the unbalanced->balanced conversion. But the ADC input pins also have a DC offset so you can't just connect one to GND for that. Impedance matching can be done as well but the impedance isn't known. ~200 Ohms seems reasonable and is mentioned in some of the tuner datasheets. 4:1 baluns that are used for cable-tv might also work, depending on the impedance of your antenna.
Tom Berger (K1TRB) used multiple core materials with trifilar wire and performed tests using his N2PK virtual network analyzer on May 19th (2013).
Hams love type 43 ferrite, but for almost every application, there is a better choice. For broadband HF transformers Steward 35T is generally a better choice. Therefore, I wound a couple transformers and did the comparison. Type 43 and 35T Transformer Material Compared
For my personal tests with direct sampling mode I ordered a couple wideband transformers from coilcraft. The PWB-2-ALB and PWB-4-ALB to be specific. I sampled the PWB-4-ALB for free and ordered 4 of the PWB-2-ALB for ~$10 shipped. Both seem to work fine though I have no means of comparative testing.
If you're particularly interested in HF work then an upconverter would be better than the HF mod. With the mod there will be aliases(*) for any frequency over 14.4 Mhz (1/2 the 28.8 clock rate). So you'd want a 14 MHz lowpass for the low end or a 14-28 MHz bandpass for the high end. And probably other little idiosyncracies. A lot of people chose to just use an upconverter instead. KF7LE wrote up short summaries comparing 16 popular upconverters.
I've been told my pin numbering doesn't correspond to the datasheets, so take that with salt. The relative positions are correct regardless of the numbering.
Since then the direct sampling branch has been integrated into main and a number of people have also done balun stuff to use both RTL2832U ADC inputs (usually the two I) in direct sampling mode. Dekar has a page showing how to use an ADSL transformer to generate signal for the ADCs differential input using pin 1 (+I) and 2(-I) on the RTL2832. mikig has a useful pdf schematic with part numbers for using wide band transformers or toroids for winding your own. Here's a series of posts from bh5ea20tb showing how to use a FT37-43 ferrite core. And another example from IW6OVD Fernando. PY4ZBZ as well. The ADC has a differential/balanced input so this is done mainly for the unbalanced->balanced conversion. But the ADC input pins also have a DC offset so you can't just connect one to GND for that. Impedance matching can be done as well but the impedance isn't known. ~200 Ohms seems reasonable and is mentioned in some of the tuner datasheets. 4:1 baluns that are used for cable-tv might also work, depending on the impedance of your antenna.
Tom Berger (K1TRB) used multiple core materials with trifilar wire and performed tests using his N2PK virtual network analyzer on May 19th (2013).
Hams love type 43 ferrite, but for almost every application, there is a better choice. For broadband HF transformers Steward 35T is generally a better choice. Therefore, I wound a couple transformers and did the comparison. Type 43 and 35T Transformer Material Compared
For my personal tests with direct sampling mode I ordered a couple wideband transformers from coilcraft. The PWB-2-ALB and PWB-4-ALB to be specific. I sampled the PWB-4-ALB for free and ordered 4 of the PWB-2-ALB for ~$10 shipped. Both seem to work fine though I have no means of comparative testing.
If you're particularly interested in HF work then an upconverter would be better than the HF mod. With the mod there will be aliases(*) for any frequency over 14.4 Mhz (1/2 the 28.8 clock rate). So you'd want a 14 MHz lowpass for the low end or a 14-28 MHz bandpass for the high end. And probably other little idiosyncracies. A lot of people chose to just use an upconverter instead. KF7LE wrote up short summaries comparing 16 popular upconverters.
Sample rates
When setting sample rates in your own programs or scripts try to use one of the values shown in,http://cgit.osmocom.org/cgit/gr-osmosdr/tree/lib/rtl/rtl_source_c.cc#n373. If it's an end-user app like SDR# or Gqrx then it handles all this for you in the background. It's handy for writing pyrtlsdr scripts though.range += osmosdr::range_t( 250000 ); // known to work range += osmosdr::range_t( 1000000 ); // known to work range += osmosdr::range_t( 1024000 ); // known to work range += osmosdr::range_t( 1800000 ); // known to work range += osmosdr::range_t( 1920000 ); // known to work range += osmosdr::range_t( 2000000 ); // known to work range += osmosdr::range_t( 2048000 ); // known to work range += osmosdr::range_t( 2400000 ); // known to work // range += osmosdr::range_t( 2600000 ); // may work // range += osmosdr::range_t( 2800000 ); // may work // range += osmosdr::range_t( 3000000 ); // may work // range += osmosdr::range_t( 3200000 ); // max rate
Noise, shielding, and cables.
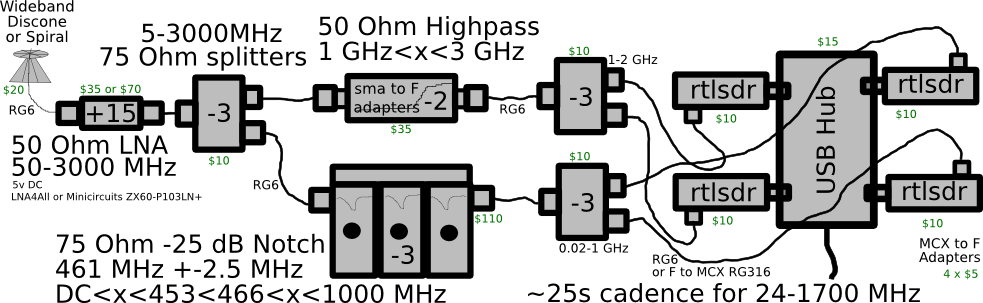
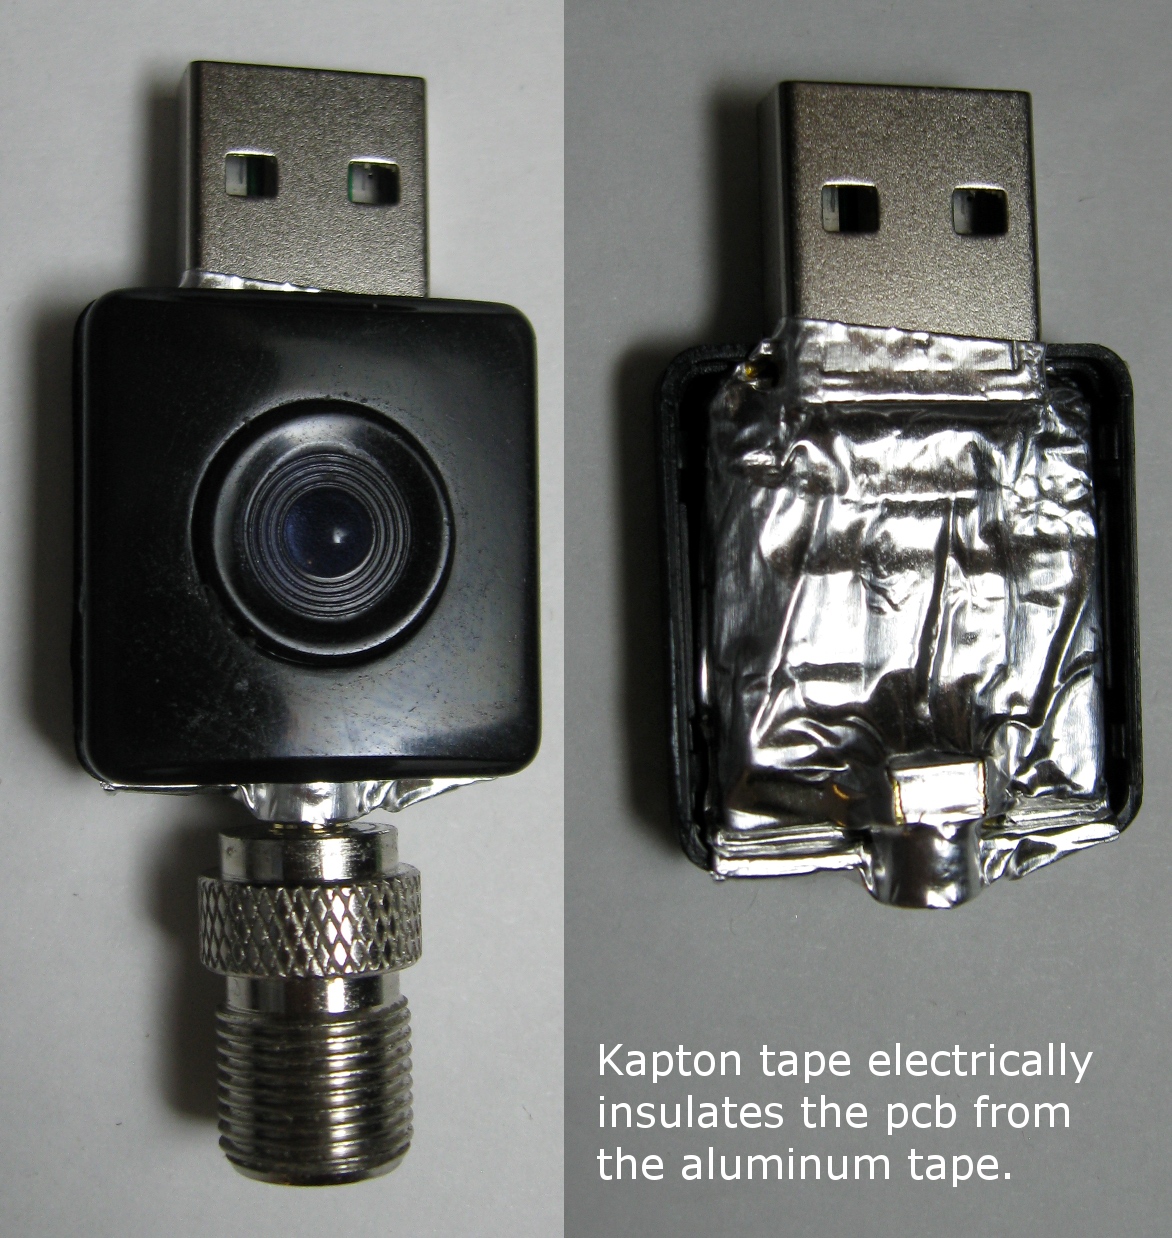
The plastic cases the dongles ship in leads electrical interference susceptability. It is best to shield and put ferrites on everythingif you can.Acinonyx describes one way to doing this using a single strip of aluminum tape combined with a spring to connect it to the dongle ground. I wrap the entire pcb, except the grounds on the connectors, with kapton tape and then use a single continuous piece of aluminum foil tape to wrap the rest of the dongle. Even sealed with aluminum tape they seem to dissipate heat and reach thermal equilibrium fine in terms PPM error. Akos Czermann at the sdrformariners blog made a somewhat confusing but definitely empirical comparison of noise levels compared to different hardware mods like disconnecting the USB ground from the rtlsdr ground. To reduce signal loss I like to run long USB *active* extension cable with hubs at the end and ferrites added instead of long coaxial cable.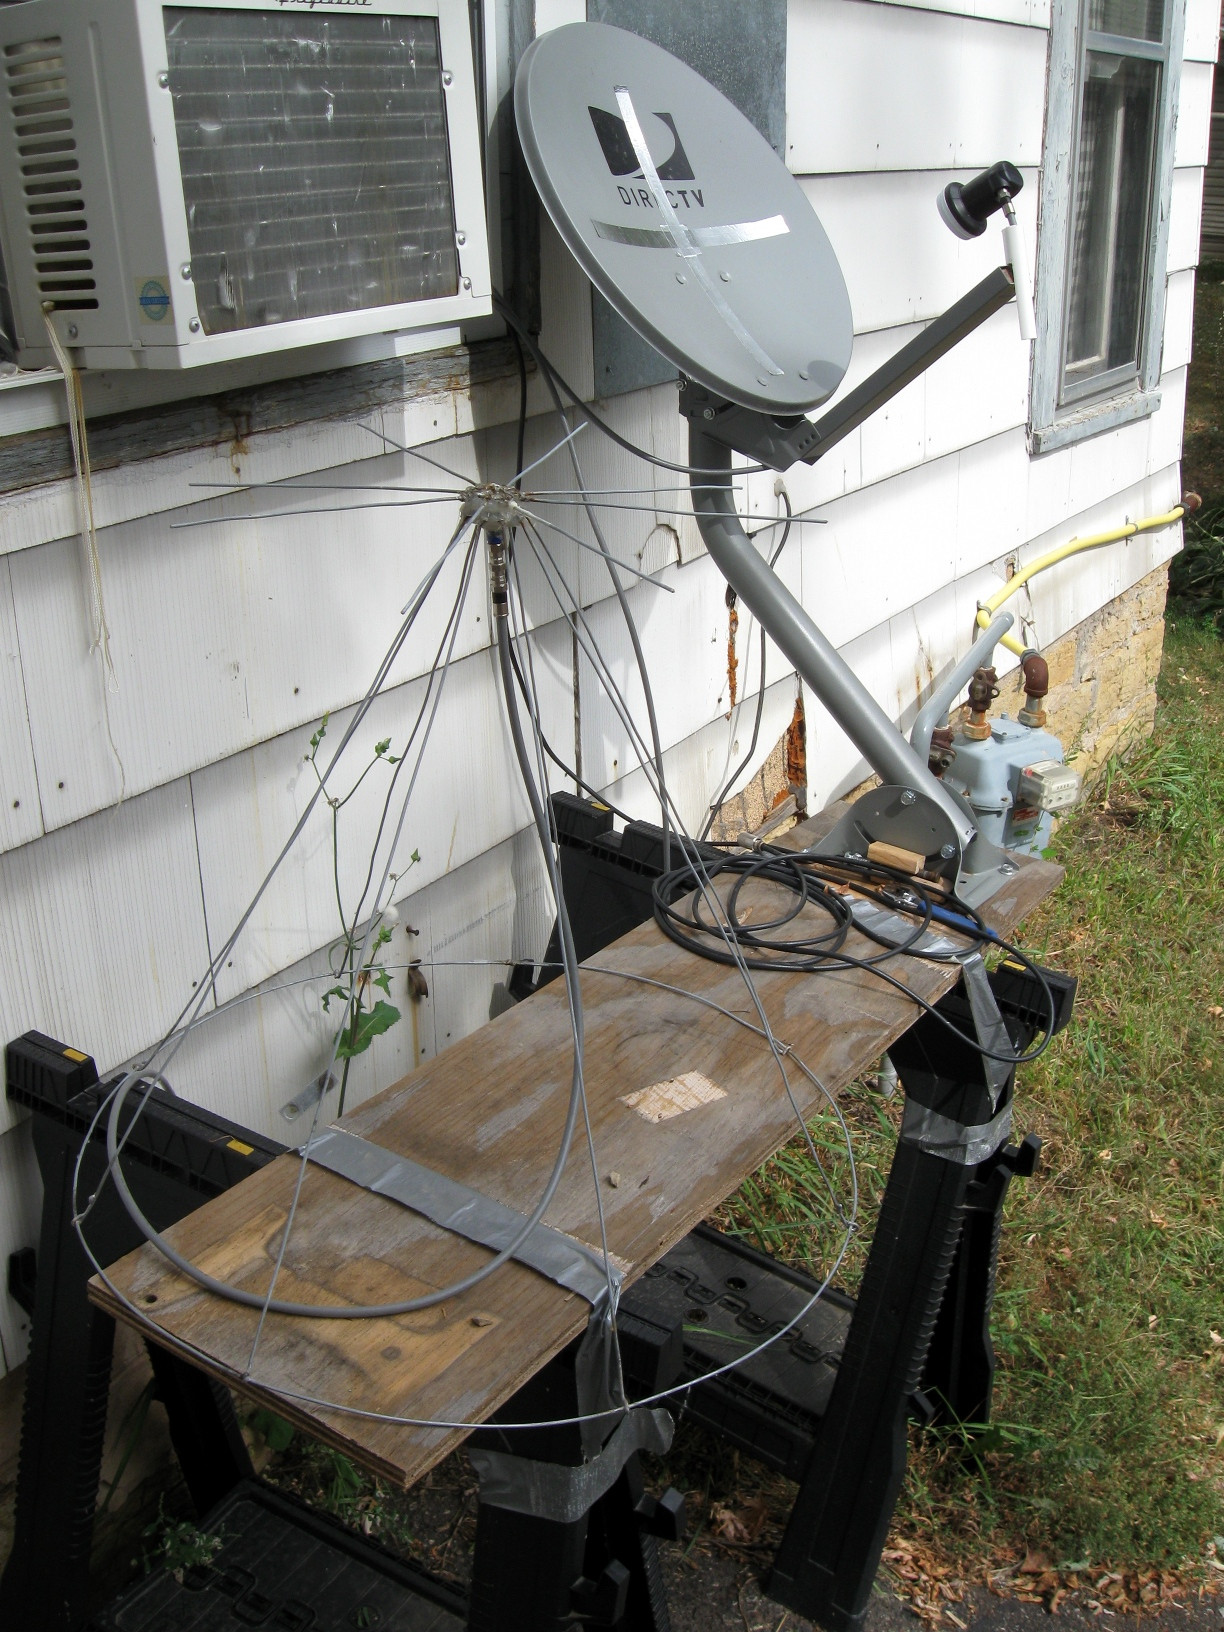
Broadband Antenna
When I want to do some scanning that takes advantage of the tuner's very wide ranges I use three types of antenna: discone, spiral, and horns. Both discone and archimedian spiral antenna can omnidirectionally cover almost the full range of the E4000 tuner but things get a bit too large to go all the way to the 24 Mhz of the R820T. You can refer to the seperate spiral antenna page for construction and technical details. To build my discone I followed Roklobsta's D.I.Y. Discone for RTLSDR. When using such broadband antenna it is possible to pick up powerful out of tuner band signals due to overloading. You can see an example of how bad this interference can be in raw sample total power measurements over time x frequency in these 2D spectral maps: 1, 2. Or in the 1D spectrum plot below,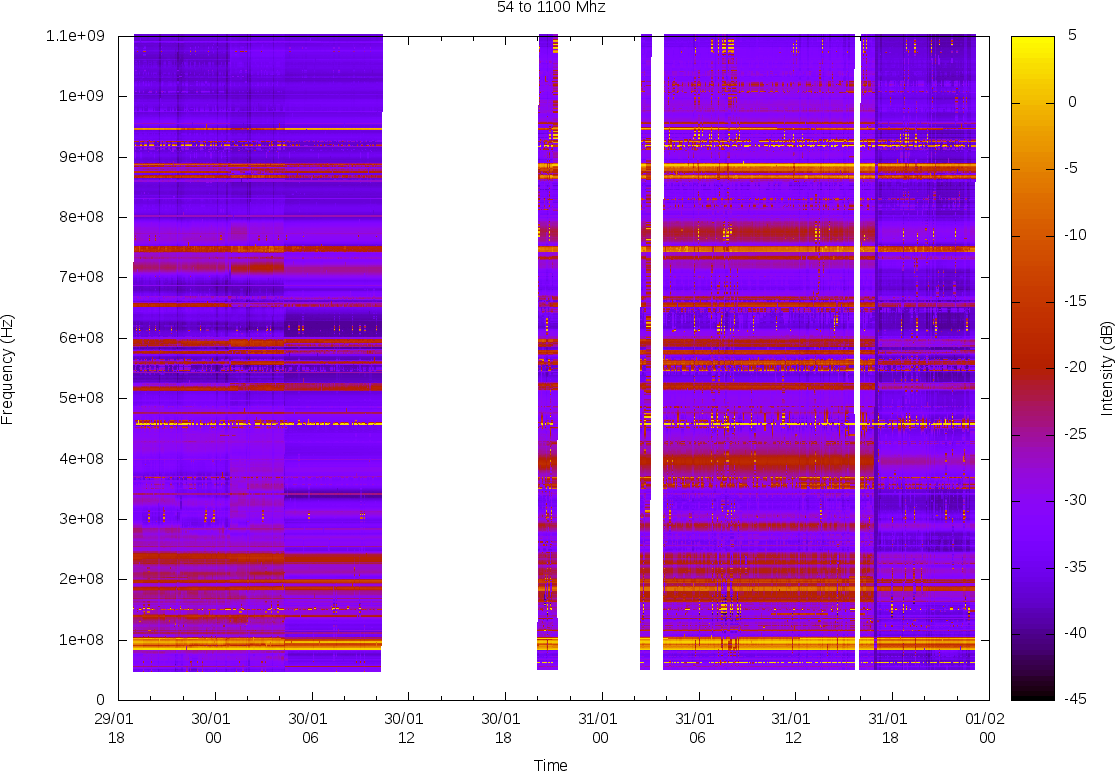
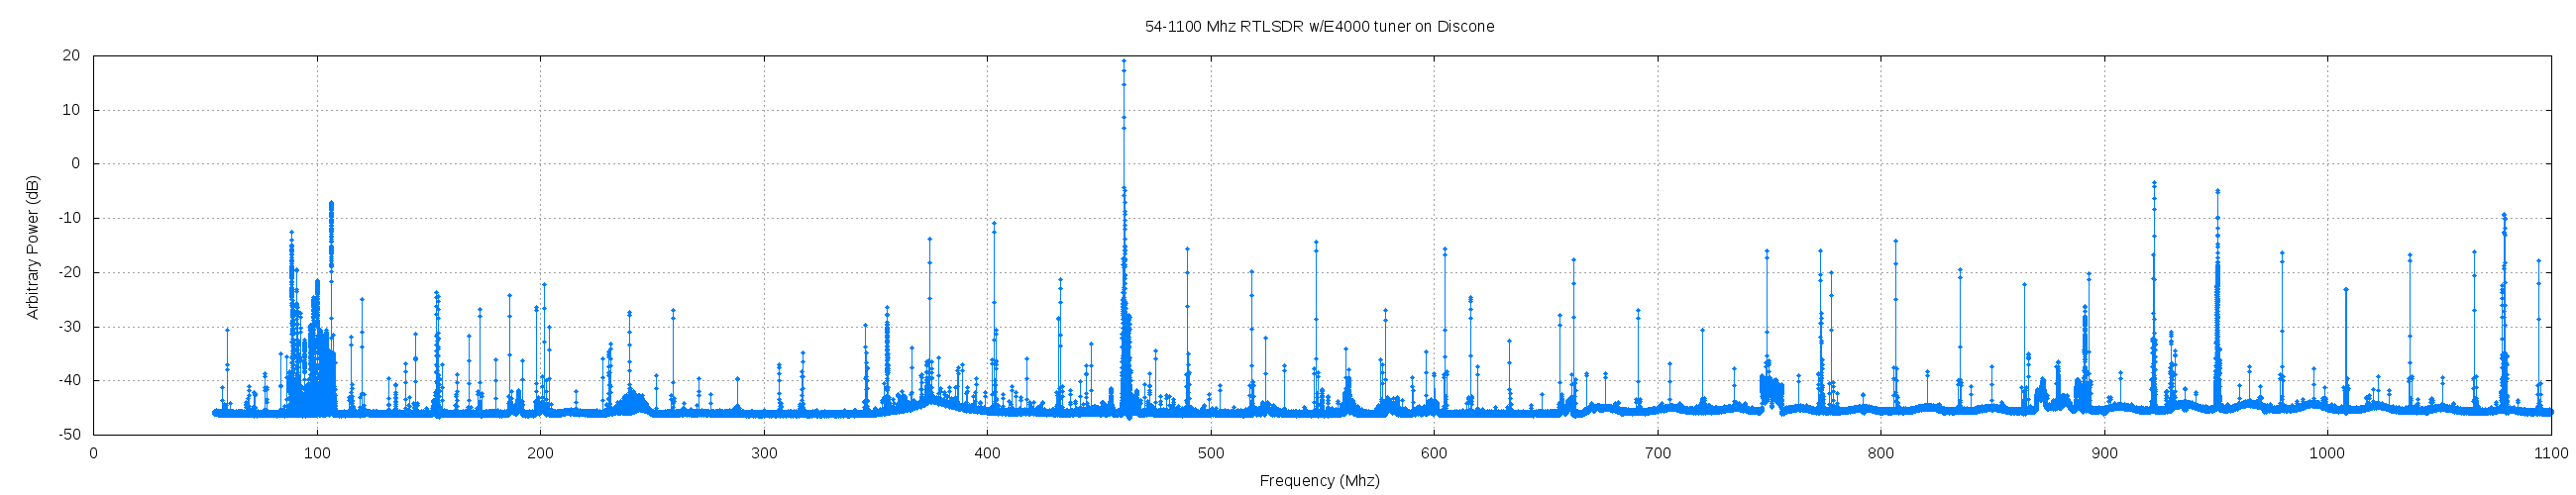 The powerful signals near 155 and 930 Mhz and particularly the university's multiple 45 watt ~461 Mhz transmitters across the street appear as images (?) all over into other frequency bands. Nasty. In the future I hope to notch them out with physical filters. The linked plot above is made with this gnuplot format and the csv output of RTLSDR Scannerusing 1 second integration times with a wire discone. [edit, 2013: I did fix this in the future with a custom made 3 cavity notch filter for 461 MHz]
The spectra and noise baselines are much cleaner when using directional and resonant antenna instead of wideband omnidirectionals like I've been using to characterize the RFI environment.
patchvonbraun suggested doing a frequency sweep with a shielded terminated resistor and then subtracting that sweeps' results from the antenna scans. RTLSDR Scanner's sweeps for the same range and sample rate always match up on frequencies. So it should be just subtracting the corresponding elements of the sorted value pairs from antenna and resistor using self.spectrum.iteritems() in RTLSDR Scanner or using unix tools with the csv. This might not be reasonable thing to do though because the values are in dB and subtraction does not work simply with dB.
keenerd did a 2 hour long integration of the noise from an R820T dongle with a terminator on the input over a very wide bandwidth. You can see it at http://kmkeen.com/tmp/r820t-noise.png. This is the kind of thing that could theoretically be used to correct like the above but so far no one has done it that I know of. I tried but I'm a terrible programmer.
The powerful signals near 155 and 930 Mhz and particularly the university's multiple 45 watt ~461 Mhz transmitters across the street appear as images (?) all over into other frequency bands. Nasty. In the future I hope to notch them out with physical filters. The linked plot above is made with this gnuplot format and the csv output of RTLSDR Scannerusing 1 second integration times with a wire discone. [edit, 2013: I did fix this in the future with a custom made 3 cavity notch filter for 461 MHz]
The spectra and noise baselines are much cleaner when using directional and resonant antenna instead of wideband omnidirectionals like I've been using to characterize the RFI environment.
patchvonbraun suggested doing a frequency sweep with a shielded terminated resistor and then subtracting that sweeps' results from the antenna scans. RTLSDR Scanner's sweeps for the same range and sample rate always match up on frequencies. So it should be just subtracting the corresponding elements of the sorted value pairs from antenna and resistor using self.spectrum.iteritems() in RTLSDR Scanner or using unix tools with the csv. This might not be reasonable thing to do though because the values are in dB and subtraction does not work simply with dB.
keenerd did a 2 hour long integration of the noise from an R820T dongle with a terminator on the input over a very wide bandwidth. You can see it at http://kmkeen.com/tmp/r820t-noise.png. This is the kind of thing that could theoretically be used to correct like the above but so far no one has done it that I know of. I tried but I'm a terrible programmer.
Chipset docs, GNU Radio, DSP, and Antenna Links
- RTL2832U Linux Driver Source (not SDR mode)
- RTL2832U Downconversion Notes (pdf)
- RTL2832U Register Notes (pdf)
- Rafael Micro R820T tuner datasheet (pdf)
- Elonics E4000 Low Power CMOS Multi-Band Tuner Datasheet (pdf)
- Elonics E4000 reference schematic (pdf)
- E4000 Benefits of DigitalTune Architecture (pdf)
- GNU Radio Wiki
- http://lists.gnu.org/pipermail/discuss-gnuradio/
- gnuradio's https://www.cgran.org/browser/projects
- oz9aec's GRC Examples
- https://github.com/csete/gnuradio-grc-examples/tree/master/receiver
- actual television decoding driver for linux, 2
- R820T DAB+ driver (related)
- balint256's GNU Radio tutorial videos
- firebyte's post on r/GNURadio
- Antenna Theory
- AT&T Archives: Similiarities of Wave Behavior - impedance explained
Page Sections
- Intro
- Hardware
- My Interferometer
- Links/Datasheets (here)
- Installing RTLSDR and GNU Radio
- RTLSDR Applications Notes
- Pagers
- Gqrx on Ubuntu 10.04
- LTE Scanner on Ubuntu 10.04
- Dongle Logger
- GNU Radio Companion
- Clocks
RTL-SDR Links
- rtl-sdr wiki - osmocom
- Known applications - rtl-sdr wiki - osmocom
- rtlsdr.org wiki
- r/rtlsdr - reddit group
- Ultra Cheap SDR - google group
- RTL-SDR - yahoo group
- AB9IL's rtl2832 software defined radio overview
Warning: I'm learning as I go along. There are errors. Refer to the proper documentation and original sources first.
GNU Radio *and* RTL-SDR Setup
You don't need GNU Radio to use the rtlsdr dongles in sdr mode, but there are many useful apps that depend on it.patchvonbraun has made setting up and compiling GNU Radio and RTLSDR with all the right options very simple on Ubuntu and Fedora. It automates grabbing the latest of everything from git and compiling. It will also uninstall any packages providing GNU Radio already installed first. Simply run, http://www.sbrac.org/files/build-gnuradio, and it'll automate downloading and compiling of prequisites, libraries, correct git branches, udev settings, and more. I had no problems using Ubuntu 10.04 AMD64 or 12.04 32bit. If you're thinking about trying this in a virtual machine: don't. If you do get it partially working it'll still suck. As an aside: If you're an OSX user then refer to dekars work for gqrx that contains rtl-sdr, gr-osmosdr, GNU Radio, libUSB, boost and Qt dependencies.mkdir gnuradio cd gnuradio wget http://www.sbrac.org/files/build-gnuradio chmod a+x build-gnuradio ./build-gnuradio --verbose # default is 3.7.2 *or* ./build-gnuradio -o --verbose # install 3.6.5.1As of 2013-10-26 it is fairly safe to use version 3.7 if this is your first install on a machine. Lots of the important applications support it but existing flowgraphs and tutorials are mostly geared for 3.6.5 still. As of 2013-12-19 there is no reason not to install 3.7.2. An (re)install looks like this. It might be useful to save the log output for future reference. Then test it. The test output below is from a very old version of rtl_test with an E4K dongle. Newer versions, and R820T tuners will output slightly different text.
rtl_test -t
Found 1 device(s):
  0:  ezcap USB 2.0 DVB-T/DAB/FM dongle

Using device 0: ezcap USB 2.0 DVB-T/DAB/FM dongle
Found Elonics E4000 tuner
Benchmarking E4000 PLL...
[E4K] PLL not locked!
[E4K] PLL not locked!
[E4K] PLL not locked!
[E4K] PLL not locked!
E4K range: 52 to 2210 MHz
E4K L-band gap: 1106 to 1247 MHz
Once GNU Radio is installed the "Known Apps" list at the rtl-sdr wiki is a good place to start. Try running a third party receiver, a python file or start up GNU Radio Companion (gnuradio-companion) and load the GRC flowcharts. If you're having "Failed to open rtlsdr device #0" errors make sure something like /etc/udev/rules.d/15-rtl-sdr.rulesexists and you've rebooted.
Updating
When updating you can just repeat the install instructions which is simple but long. The advantage to repeating the full process is mainly if there are major changes in the gr-osmosdr as well as rtl-sdr. It'll do things like ldconfig for you../build-gnuradio -e gnuradio_buildIf you don't have the patience for a full recompile and there haven't been major gnu radio or gr-osmosdr changes it's much faster just to recompile rtl-sdr by itself. The instructions to do so are at the osmosdr page. It'll only take a few minutes even on slow machines. Once you have the latest git clone it is like most cmake projects:
git clone git://git.osmocom.org/rtl-sdr.git
cd rtl-sdr; mkdir build; cd build; cmake ../ ; make; sudo make install; sudo ldconfig
rtl-sdr supporting receivers, associated tools
- keenerd's rtl-sdr branch
- This experimental branch contains a number of useful low processing power utilities, expansions of the original rtl tools, and improvements to the R820T driver re-tuning speed. A lot of them have already been merged into the librtlsdr master but rtl_fm and rtl_power fixes, features and bugs appear here first. rtl_fm is for scanning, listening, and decoding (and not just FM), rtl_adbs for plane watching with an external ads-b viewer, rtl_eeprom for checking and *setting* serial numbers and related data if your dongle has an eeprom. And as of 2013-09-20, rtl_power, a total power frequency scanner. These tools are very good for slow machines (atom) or when you want to do command line automation. Just build it like the osmocom rtlsdr page does for the vanilla install. Use these on the raspberry pi.
git clone https://github.com/keenerd/rtl-sdr.git
cd rtl-sdr; mkdir build; cd build; cmake ../; make; cd src;
Most people use rtl_power for smaller total bandwidths (<200 MHz) and higher spectral resolution using the default FFT mode. This is visualized with keenerd's heatmap.py and can result in some really impressive plots when done with ~25% crop mode. Just refer to the -h "help" in rtl_power for instruction. For RMS average power mode, which kicks in automatically for FFT bin sizes 1 MHz and larger, I do visualization of the resulting .csv file with gnuplot. Because the entire bandwidth is summed and saved as one value the the data rate to disk, and spectrogram dimensions are much lower than FFT mode. Example gnuplot visualization, annotated, and the gnuplot format, and colour palettes used to generate them. If you do a large number of frequency hops, (hundreds) then the time adds up. On my two computers the R820T tuner dongles average about 55 milliseconds per retune and sample cycle. I sometimes have dongles that'll fail to lock pll and go into a loop. The -e parameter sets a time limit for a run. Combining this time limit with a bash while loop results in pretty low downtime with resiliance to rtlsdr and USB failures.# 0.055 seconds *((1724-24) MHz/(1 MHz)) = 93.5 seconds = "-i". while true; do ./rtl_power -f 24M:1724M:1M -i 94 -g 20.7 -p 30 -e 1h >> 2013-12-02_totalpower_r820t_24-1724_1M_94s.csv; done
To combine the results from multiple dongles just cat the files together. But on gnuplots end each new .csv filename requires you to manually edit the gnuplot format. Additionally you need to set the output spectrogram filename and a pixel width. I find for 1000 Mhz @ 1 MHz that approximately 1000px per 100 MB of file size is required to cover all gaps.gnuplot gnuplot-format-rms-mode.txt
And that pops out a png. For rtl_fm stuff refer to keenerd's site's Rtl_fm Guide.
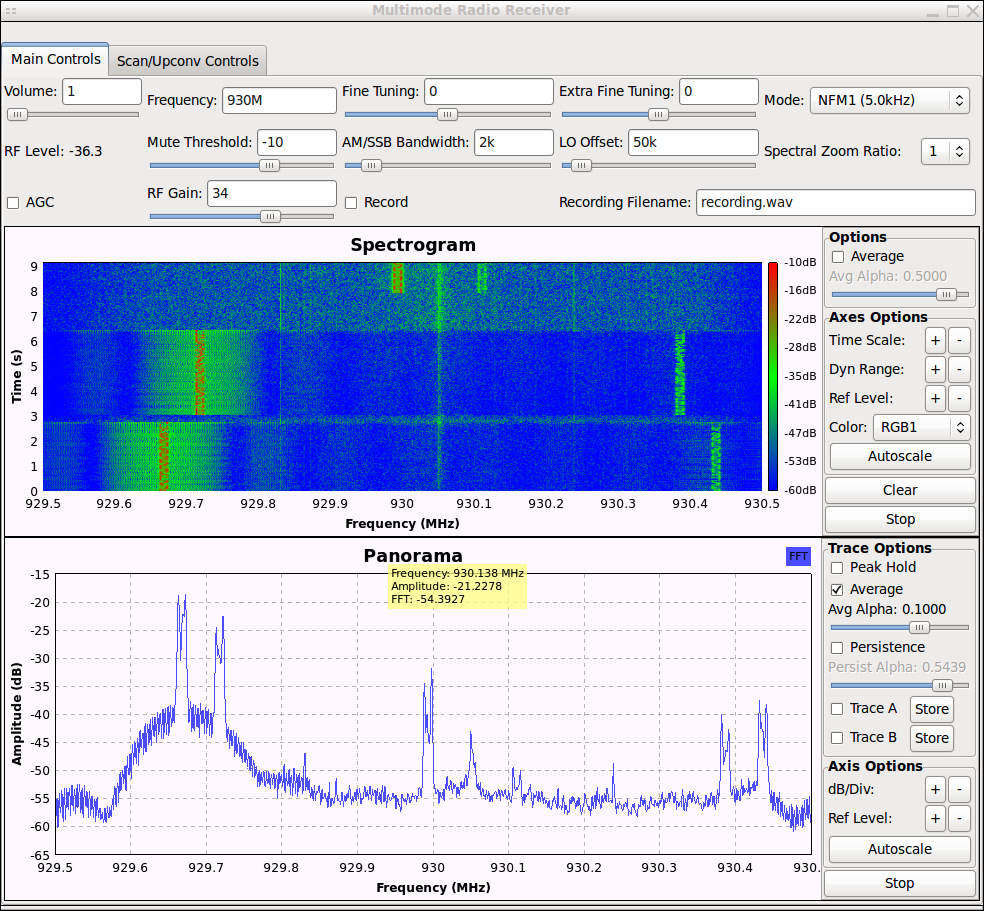
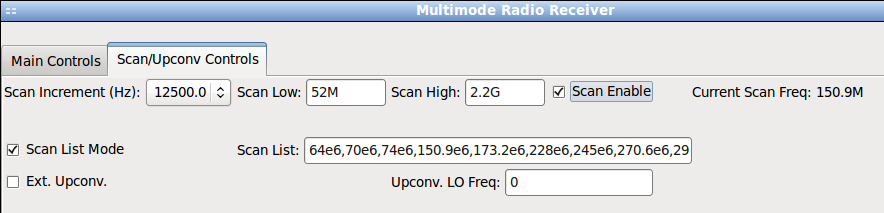
- patchvonbraun (Marcus Leech)'s multimode:
- AM, FM, USB, LSB , WFM. TV-FM, PAL-FM. Very nice, easy to use (screenshots: main, scanning). It has an automated scanning and spectral zoom features with callbacks to click on the spectrogram or panorama to tune to the frequency of interest. There's a toggle for active gain control too. The way to get it is,
svn co https://www.cgran.org/svn/projects/multimode
then instead of using GRC, just run the multimode.py as is.make install python multimode.py
If you run it outside of the svn created directory you might need to append ~/bin to pythonpath to find the helper script. If you used build-gnuradio it'll tell you what this is at the end of the install. Alternately set it in your ~/.bashrc. If you do the below make sure to reload in the terminal by "source ~/.bashrc")PYTHONPATH=/usr/local/lib/python2.6/dist-packages:~/bin export PYTHONPATH;
When setting the sample rate it is rounded-down to a multiple of 200 Ksps so the decimation math works out.python multimode.py --srate=2.4M # use normal mode with 2.4 MHz bandwidth ./multimode.py --devinfo="rtl=0,direct_samp=1" # use direct sample mode python multimode.py --help
If you have overruns like "OOOOoo..." then try reducing the sample rate or pausing the waterfall or spectrum displays. "The audio subsystem uses 'a' as the identifier, and UHD uses 'u'. With RTLSDR, it'll issue 'O' when it experiences an overrun. Which means that your machine isn't keeping up with the data stream. Sometimes buffering helps, but only if your machine is right on the edge of working properly. If it really can't, on average "keep up", no amount of buffering will help." If you have overruns like "aUaUaUaUa" or just "aaa" then the audio system is asking for samples at a higher rate than the DSP flow can provide (44vs48Khz, etc). Use "aplay -l" to get a list of the devices on your system.aplay -l
The hw:X,Y comes from this mapping of your hardware -- in this case, X is the card number, while Y is the device number. Or you can use "pulse" for pulseaudio. Try specifying,python multimode.py--ahw hw:0,0
- AM, FM, USB, LSB , WFM. TV-FM, PAL-FM. Very nice, easy to use (screenshots: main, scanning). It has an automated scanning and spectral zoom features with callbacks to click on the spectrogram or panorama to tune to the frequency of interest. There's a toggle for active gain control too. The way to get it is,
- gqrx:
- Written by Alexandru Csete OZ9AEC "gqrx is an experimental AM, FM and SSB software defined receiver". The original version did not have librtlsdr support so changes were made by a number of others to add it. A couple weeks later Csete added gr-osmosdr support to the original. Dekar established a non-pulseaudio port of gqrx for Mac OSX. GNU Radio 3.7 has recently been released and it is not exactly backwards compatible. patchvonbraun's build-gnuradio.sh pulls
3.6.53.7.x by default.As of August 9th 2013 Gqrx 2.2.0 has been released. This upgraded version can now be installed as binaries with all of it's dependencies pre-packaged on both Ubuntu linux (a custom PPA, no 10.04 packages) and Mac OS X! That includes all the GNU Radio stuff. So this is an all-in-one alternative to building GNU Radio from source. I think this person's guide is better than mine.git clone https://github.com/csete/gqrx.git cd gqrx # on Ubuntu/Debian, sudo apt-get install qtcreator , if you don't have it. qtcreator gqrx.pro # press the build button (the hammer) # or avoid qtcreator and do it manually. if you have qt5 too, use "qmake-qt4" qmake make
- rtlsdr w/Gqrx on N900 phones
- xes provides pre-compiled packages of Gqrx and the GNU Radio dependencies for N900 linux cell phones.
- Written by Alexandru Csete OZ9AEC "gqrx is an experimental AM, FM and SSB software defined receiver". The original version did not have librtlsdr support so changes were made by a number of others to add it. A couple weeks later Csete added gr-osmosdr support to the original. Dekar established a non-pulseaudio port of gqrx for Mac OSX. GNU Radio 3.7 has recently been released and it is not exactly backwards compatible. patchvonbraun's build-gnuradio.sh pulls
- SDR#:
- Written by prog (Youssef) for Windows. It is probably the best general software for rtlsdr devices in terms ofperformance. It is updated very often as well. At the rtlsdr.org wiki there is a guide to running the original C# version under linux with mono but that only works for old versions. Instead look at ryan_turner's example install at http://pastebin.com/tgYwRBQt (local mirror). Mono is a little slow, but if you restrict the sample rate it works fine. It's probably the easiest program to use and it has the best DSP and features for dealing with the quirks of the rtlsdr dongles. As of 2012-10-07 it also has GUI toggles for the direct sampling mode to listen to <30Mhz signals. In 0.25 MS/s mode it can even run on my old 1.8Ghz P4 laptop.
To compile it on Ubuntu 10 or 12 consult KJ4EHD ryan_turner's http://pastebin.com/tgYwRBQt. Don't execute this because it is old. The "Release" dir hardcoded in is now "Debug".
sudo apt-get install subversion git mono-complete libportaudio2 monodevelop icoutils
svn checkout https://subversion.assembla.com/svn/sdrsharp/
cd sdrsharp/trunk
yulian's comment tipped me off that SDRSharp.sln has to be edited for older versions of mono (like from Ubuntu 12.04). Open it and change Microsoft Visual Studio Solution File, Format Version 12.00 to 11.00 and Visual Studio 2012 to 2010 and it will compile.mdtool build -c:Release SDRSharp.sln cd Release ln -s /usr/local/lib/librtlsdr.so librtlsdr.dll ln -s /usr/lib/x86_64-linux-gnu/libportaudio.so.2 libportaudio.so # modify config sed -i '/SDRSharp.SoftRock.SoftRockIO,SDRSharp.SoftRock/d' SDRSharp.exe.config sed -i '/SDRSharp.FUNcube.FunCubeIO,SDRSharp.FUNcube/d' SDRSharp.exe.config sed -i '/SDRSharp.FUNcubeProPlus.FunCubeProPlusIO,SDRSharp.FUNcubeProPlus/d' SDRSharp.exe.config sed -i '/SDRSharp.RTLTCP.RtlTcpIO,SDRSharp.RTLTCP/d' SDRSharp.exe.config sed -i '/SDRSharp.SDRIQ.SdrIqIO,SDRSharp.SDRIQ/d' SDRSharp.exe.config sed -i 's/<!-- <add key="RTL-SDR \/ USB" value="SDRSharp.RTLSDR.RtlSdrIO,SDRSharp.RTLSDR" \/> -->/<add key="RTL-SDR \/ USB" value="SDRSharp.RTLSDR.RtlSdrIO,SDRSharp.RTLSDR" \/>/' SDRSharp.exe.config
As of Sun May 5th 2013 there's a test version with an amazing new noise reduction algorithm (for voice?) at:http://sdrsharp.com/downloads/sdrsharp.dnr.zip - ADBS# is another easy to use application by prog, but specifically for plotting aviation transponders like gr-air-modes does. The distributed binaries also runs under linux with mono (or native in windows) and output virtualradar compatible data on 127.0.0.1:47806. If your antenna condition is crappy, try using filter = 1.
- Written by prog (Youssef) for Windows. It is probably the best general software for rtlsdr devices in terms ofperformance. It is updated very often as well. At the rtlsdr.org wiki there is a guide to running the original C# version under linux with mono but that only works for old versions. Instead look at ryan_turner's example install at http://pastebin.com/tgYwRBQt (local mirror). Mono is a little slow, but if you restrict the sample rate it works fine. It's probably the easiest program to use and it has the best DSP and features for dealing with the quirks of the rtlsdr dongles. As of 2012-10-07 it also has GUI toggles for the direct sampling mode to listen to <30Mhz signals. In 0.25 MS/s mode it can even run on my old 1.8Ghz P4 laptop.
To compile it on Ubuntu 10 or 12 consult KJ4EHD ryan_turner's http://pastebin.com/tgYwRBQt. Don't execute this because it is old. The "Release" dir hardcoded in is now "Debug".
- gr-fosphor:
- gr-fosphor is an amazingly fast and information dense spectrogram and waterfall visualization using OpenCL hardware acceleration. It surpasses the Wx widget elements in performance, and so usability, by far. With this visualization you can easily skip through 1 GHz of spectrum very quickly and actually notice transient signals as they pass. Right now it is not very configurable, just arrow keys for scale. But expect this to be the preferred visualization block in the future. I have written up an barebones guide to installing gr-fosphor on Ubuntu 12.04.
- gr-air-modes:
- A decoder of aviation transponder Mode S including ads-b reports near 1090 Mhz. It can be coupled to software to show plane positions in near real time (ex: VirtualRadar). This works under mono on Ubuntu 12.04 but not 10.04. Originally written by Nick Foster (bistromath) and adapted to rtlsdr devices first by Steve Markgraf (stevem), bistromath later added rtlsdr support. Here's an example of basic decoding done with the stock antenna on the early version by stevem. Nowdays it's better to use bistromaths'.As of July 23, 2013 there was a major update to gr-air-modes which now includes a nice google maps overlay andworks on gnu radio 3.7 branch only.
git clone https://github.com/bistromath/gr-air-modes.git
Here's an example of install process and first run looks like.# -d stands for rtlsdr dongle, location is "North,East" uhd_modes.py -d --location "45,-90"
To use with virtual radar output add the below -P switch. Then open up virtualradar with mono and go to tools->options->basestation and put in the IP of the computer running uhd_modes. There are not many compatible planes in the USA so far so even if you are seeing lots of Mode-S broadcast in uhd_modes you might not see anything in virtualradar. Sometimes my server is running at superkuh.com:81/VirtualRadar/GoogleMap.htm.uhd_modes.py -d --location "45,-90" -P mono VirtualRadar.exe
Modesbeast has a diagram of a colinear antenna for this purpose.
- A decoder of aviation transponder Mode S including ads-b reports near 1090 Mhz. It can be coupled to software to show plane positions in near real time (ex: VirtualRadar). This works under mono on Ubuntu 12.04 but not 10.04. Originally written by Nick Foster (bistromath) and adapted to rtlsdr devices first by Steve Markgraf (stevem), bistromath later added rtlsdr support. Here's an example of basic decoding done with the stock antenna on the early version by stevem. Nowdays it's better to use bistromaths'.As of July 23, 2013 there was a major update to gr-air-modes which now includes a nice google maps overlay andworks on gnu radio 3.7 branch only.
- Dump1090:
- Dump 1090 is a Mode S decoder specifically designed for RTLSDR devices.
Antirezs' ADS-B program is really slick. It does not depend on GNU Radio, has a number of interactive modes, and it even optionally runs it's own HTTP server with googlemaps overlay of discovered planes; no virtualradar needed. It uses very little CPU and has impressive error correction. This is your best choice to play with plane tracking quickly.
# run cli interactively and create a googlemaps server on localhost port 8080
./dump1090 --aggressive --interactive --net-http-port 8080
# submit plane data to a tracking server
./dump1090 --aggressive --raw | socat -u - TCP4:sdrsharp.com:47806
- Dump 1090 is a Mode S decoder specifically designed for RTLSDR devices.
Antirezs' ADS-B program is really slick. It does not depend on GNU Radio, has a number of interactive modes, and it even optionally runs it's own HTTP server with googlemaps overlay of discovered planes; no virtualradar needed. It uses very little CPU and has impressive error correction. This is your best choice to play with plane tracking quickly.
- linrad:
- A guide on how to use linrad with rtl-sdr, and a modification to the the librtlsdr e4000 tuner code to disable digital active gain! reddit thread "I tried various bits blindly and found a setting that eliminates the AGC in the RTL2832 chip. That is a significant part of the performance improvement." As of 2012-07-07 this feature was added to the main (librtlsdr) driver as well.
- LTE Cell Scanner and LTE Tracker:
- "This is an LTE cell searcher that scans a set of downlink frequencies and reports any LTE cells that were identified. A cell is considered identified if the MIB can be decoded and passes the CRC check." "LTE-Tracker is a program that continuously searchers for LTE cells on a particular frequency and then tracks, in realtime, all found cells. With the addition of a GPS receiver, this program can be used to obtain basic cellular coverage maps." The author had only tested it on Ubuntu 12.04 but with some frustrating work replacing cmake files and compiling dependencies I made it work on 10.04. Scanner is very useful to get your dongle's frequency offset reliably and Tracker is very pretty.
- kalibrate-rtl:
- "Kalibrate, or kal, can scan for GSM base stations in a given frequency band and can use those GSM base stations to calculate the local oscillator frequency offset." The code was written by Joshua Lackey and made rtlsdr accessible by stevem. There is also a windows build made by Hoernchen. When you're using this to find your frequency error it's important to use the -e option to specify intial error. 270k of bandwidth is used for GSM reception and if the error of the dongle is too large the FCCH-peak is outside the range. I compiled some install process and example usage notes.
- Simple FM (Stereo) Receiver
- simple_fm_rcv also by patchvonbraun is the best sounding and tuning commercial FM software in my opinion. He released a major update to his gnuradio creation at the end of October.
svn co https://www.cgran.org/svn/projects/simple_fm_rcv
cd simple_fm_rcv/
cd trunk
less README
make
make install
## it'll install to ~/bin/, so I use ~/superkuh/bin below
set PYTHONPATH=/usr/local/lib/python2.6/dist-packages:/home/superkuh/bin
# run the python script
python simple_fm_rcv.py
# or edit it
gnuradio-companion simple_fm_rcv.grc
- simple_fm_rcv also by patchvonbraun is the best sounding and tuning commercial FM software in my opinion. He released a major update to his gnuradio creation at the end of October.
- my DongleLogger:
- I wrote these scripts do automatic generation of 1D spectrograms, per frequency time series plots of total power, and 2D spectral maps over arbitrary frequency ranges using multiple dongles at once. There is almost no DSP done and it is very simple but the wideband spectrograms and time series can be informative and fun regardless. It uses gnuplot for graphics generation. Obsolete. Use rtl_power instead. You can see a typical gallery output at, http://erewhon.superkuh.com/gnuradio/live/ but more useful are thegnuplot spectrograms it can make.
- simple_ra: simple radio astronomy
- A simple, GRC-based tool for small-scale radio astronomy, providing both Total Power and Spectral modes. It has a graphical stripchart display, and a standard FFT display. It also records both total-power and spectral data using an external C program that records the data along with timestamps based on the Local Mean Sidereal Time.
This is another incredible tool by patchvonbraun. It does all the heavy lifting of integration over time and signal processing to get an accurate measurement of absolute power over a range. With it he has managed to pick out the transit of the milky way at the neutral hydrogen frequency using rtlsdr sticks and a pair of yagi antenna. The log file format is text and fairly easy to parse with gnuplot but it comes with 'process_simple_tpdat' for cutting it into the bits you want and making total power or spectral component graphs. It'll make a directory called "simple_ra_data" in your home by default. Don't forget to set the --devid to rtl otherwise gnuradio won't find the gr-osmosdr source and it'll substitute a gaussian noise source.
svn co https://www.cgran.org/svn/projects/gr-ra_blocks
cmake . ; make ; sudo make install ; sudo ldconfig

svn co https://www.cgran.org/svn/projects/simple_ra
cd simple_ra; cd trunk;
make
make install
# Using a single E4k tuner
./simple_ra --devid rtl=0,offset_tune=1 --longitude -45
# Using a second dongle with R820T tuner
./simple_ra --devid rtl --longitude -45
# Use direct sample mode @ 1.25 MHz, log once per second, set longitude
./simple_ra --devid rtl=0,direct_samp=1 --freq 1.25e6 --longitude -90 --lrate 1
# generate multi-day averaged gnuplots using sidereal time
process_simple_tpdat 02:00:00 2.0 -t "11 GHz Test" -f 11ghz.png ~/simple_ra_data/tp-20130329-*.dat ~/simple_ra_data/tp-20130328-*.dat ~/simple_ra_data/tp-20130327-*.dat
./simple_ra -h (README)
As of ~Jul 5th 2013 there have been big changes to GNU Radio and as a result, simple_ra. It now depends on external packages from CGRAN. Here's what I suggest you do: pull and run the latest build-gnuradio. pull gr-ra_blocks of CGRAN, and build/install that. pull latest simple_ra from CGRAN, and build and install that.
- A simple, GRC-based tool for small-scale radio astronomy, providing both Total Power and Spectral modes. It has a graphical stripchart display, and a standard FFT display. It also records both total-power and spectral data using an external C program that records the data along with timestamps based on the Local Mean Sidereal Time.
This is another incredible tool by patchvonbraun. It does all the heavy lifting of integration over time and signal processing to get an accurate measurement of absolute power over a range. With it he has managed to pick out the transit of the milky way at the neutral hydrogen frequency using rtlsdr sticks and a pair of yagi antenna. The log file format is text and fairly easy to parse with gnuplot but it comes with 'process_simple_tpdat' for cutting it into the bits you want and making total power or spectral component graphs. It'll make a directory called "simple_ra_data" in your home by default. Don't forget to set the --devid to rtl otherwise gnuradio won't find the gr-osmosdr source and it'll substitute a gaussian noise source.
- RTLSDR-Scanner
- Ear to Ear Oak made this wideband total power scanner that generates 1D spectrum plots over any tunable ranges with arbitrary integration times. It can update a matplotlib python plot GUI in real time and has the ability to output cvs values as well as an internal format. It's very useful for finding what's broadcasting in your area quickly. Using it's csv output and gnuplot I visualized a scan from 54-1100 MHz.
If you want to use the data in gnuplot you have to sort it and make sure the header is commented out.
sort -n 54-1100_500ms.csv > sorted_54-1100_500ms.csv
Here are some example gnuplot formats for the data. You can comment out the header manually but I instead prefixed a hash to the log writing behavior at line 786,handle.write("# Frequency (MHz),Level (dB)\n")
- Ear to Ear Oak made this wideband total power scanner that generates 1D spectrum plots over any tunable ranges with arbitrary integration times. It can update a matplotlib python plot GUI in real time and has the ability to output cvs values as well as an internal format. It's very useful for finding what's broadcasting in your area quickly. Using it's csv output and gnuplot I visualized a scan from 54-1100 MHz.
If you want to use the data in gnuplot you have to sort it and make sure the header is commented out.
Pager stuff
- Thomas Sailer's multimon, "Linux Radio Transmission Decoder" which I use to (try to) decode pager transmissions around 930Mhz. And more recently Dekar's multimonNG, a fork with improved error correction, more supported modes, and *nix/osx/windows support. Dekar also supplied a GRC receiver for pagers to decode pager transmissions in real-time using fifos. zarya has made rtl_flex.py, a gnuradio based flex decoder for pagers. It can be used to decode dutch p2000 messages, for example. This fills a gap in multimon-ng pager support.
DongleLogger: my pyrtlsdr lib based spectrogram and signal strength log and plotter
Purpose:
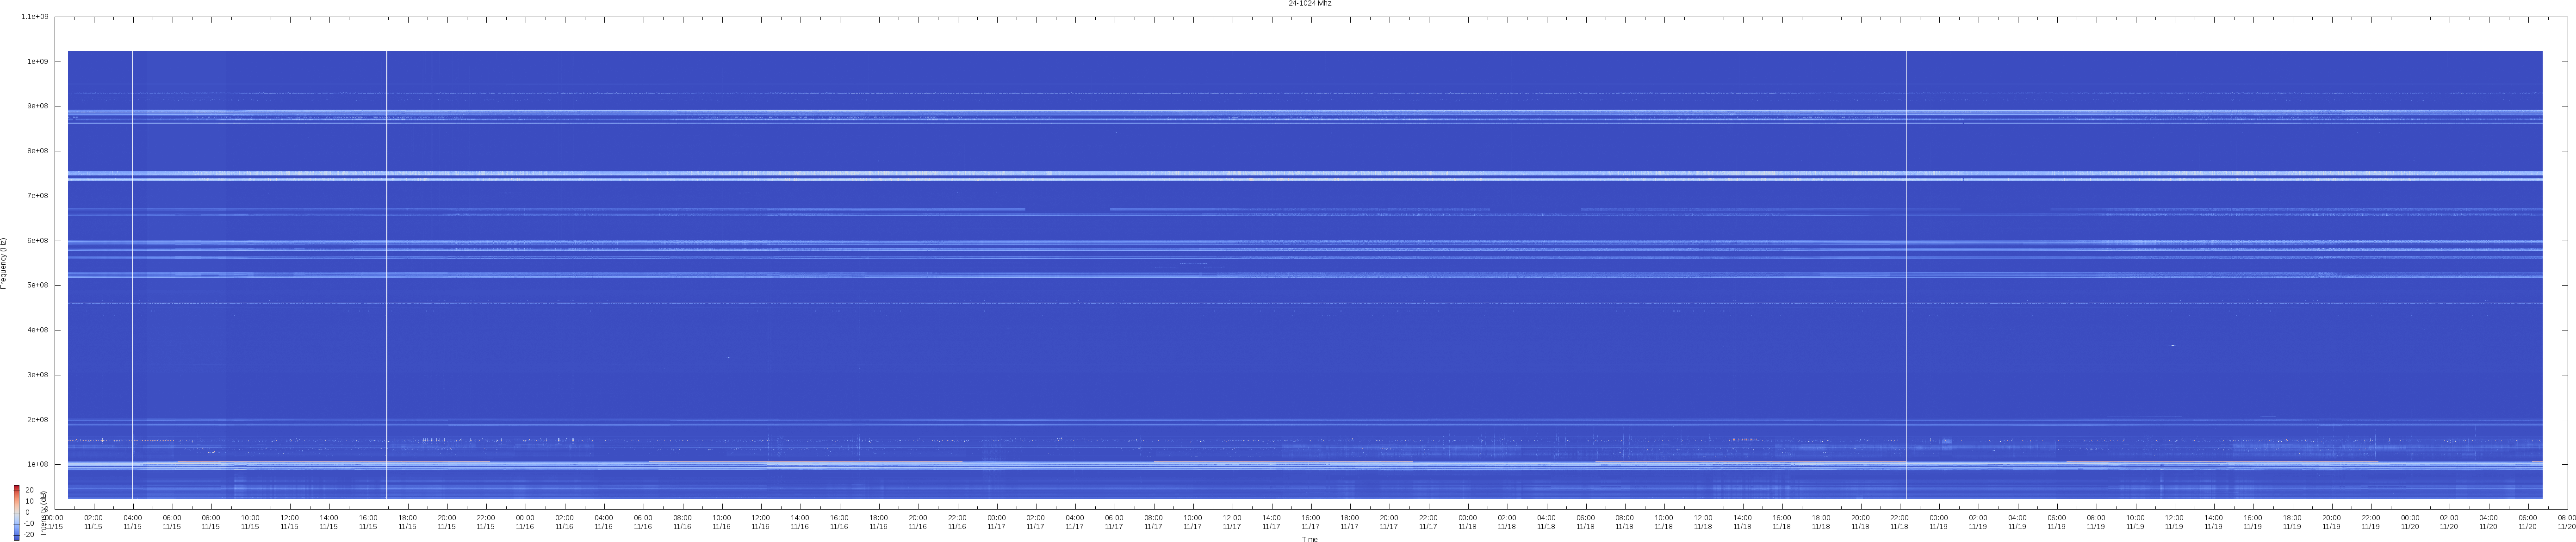
Automatic generation of and html gallery creation of wideband spectrograms using multiple rtlsdr dongles to divide up the spectrum. It also produces narrow band total charts, and other visualizations.(not live): http://erewhon.superkuh.com/gnuradio/live/ - click the spectrograms for time series plot
These scripts cause the rtlsdr dongle to jump from frequency to frequency as fast as they can and take very rough total power measurement. This data is stored in human readable logs and later turned into wideband spectrograms by calling gnuplot. In order to further increase coverage of any given spectrum range multiple instances of the script can be run at once in the same directory adding to the same logs. Their combined output will be represented in the spectrogram.Details:
I don't know much python but the python wrapper for librtlsdr pyrtlsdr was a bit easier to work with than gnu radio when I wanted to do simple things without a need for precision or accuracy. Actualy receivers with processing could be made with it too, but not by me. This is the gist of what it does,power = 10 * math.log10(scan[freq]) = scan = self.scan(sdr, freq) = capture = sdr.read_samples(self.samples) = iq = self.packed_bytes_to_iq(raw_data) = raw_data = self.read_bytes(num_bytes)The pyrtlsdr library can be downloaded by,
git clone https://github.com/roger-/pyrtlsdr.gitI have used the "test.py" matplotlib graphical spectrogram generator that came with pyrtlsdr as a seed from which to conglomerate my own program for spectrum observation and logging. Since I am not very good with python I had to pull a lot of the logic out into a perl script. So everything is modular. As of now the python script generates the spectrogram pngs and records signal strength (and metadata) in frequency named logs. It is passed lots of arguments. These arguments can be made however you want, but I wrote a perl script to automate it along with a few other useful things. It can generate a simple html gallery of the most recent full spectral map and spectrograms with each linked to the log of past signal levels. Or it can additionally generate gnuplot time series pngs (example) and link those intead of the raw logs. It also calls LTE Cell Scanner and parses out the frequency offset for passing to graphfreq.py for correction. I no longer have it running because of the processor usage spikes which interrupt daily tasks. In the past I'd have rsync updating the public mirror with a big pipe every ~40 minutes.
Modifying pyrltsdr
As it is pyrtlsdr does not have the get/set functions for frequency correction even if I sent the PPM correct from the perl script. Since the hooks (?) were already in librtlsdr.py (line 60-66) but just not pythonized in rtlsdr.py they were easy to add to the library. These changes are required to use frequency correction and make the int variable "err_ppm" available. I have probably shown that I don't know anything about python with this description. I forked roger-'s pyrtlsdr on github and added them there for review or use,https://github.com/superkuh/pyrtlsdr/commit/ffba3611cf0071dee7e1efec5c1a582e1e344c61. I apologize for cluttering up the pyrtlsdr namespace with such trivial changes but I'm new to this and github doesn't allow for private repositories.What you should be using instead.
- RTLSDR Scanner by Ear To Ear Oak is awesome for generating 1D wideband spectrograms.
- Enoch Zembecowicz made a polished and useful sdr logging tool
- Panteltje's rtl_sdr_scan is another tool like RTLSDR Scanner for 1D total power scans. It is a good reference for using librtlsdr with C.
- If you are serious about measuring total power over one 2.5 Mhz range then simple_ra, or simple radio astronomy, is best.
- rtl_power was recently (2013-08-20) released by keenerd. It does most of what my scripts do, except much better, faster, and easier. I highly recommend you try it first.
Download
fast version: see below
- donglelogger-faster.tar.gz - all needed files including pyrtlsdr
-
- radioscan_faster.pl - pyrltsdr using script; frequency setting and incrimenting, sampling, and logging.
- graphfreqs_faster5.py - option passing, log parsing, plot making, frequency corrections wrapper, html image gallery generation
- graphfreqs_gnuplot.py - legacy functions
slow version:
- graphfreqs.py - pyrltsdr using script; sampling, and logging
- radioscan.pl - manages graphfreqs, parses logs, makes plots, gets frequency corrections, generates gallery
The faster version
Speed ups, Inline C usb reset, and avoiding dongle reinitialization... (less options)
cli switches/options
-dev 1			:: rtlsdr device ID (use to pick dongle)
-g 30			:: gain
-s 			:: interval between center frequencies
-r 2400000		:: sample rate
-d2 /path/here		:: path to the directory to put logs, plots, gallery
-c 751			:: LTC Cell scanner frequency offset correction, takes freq in Mhz of base cell
-w			:: turn on web gallery generation
-p			:: turn on gnuplot time series charts for every freq (don't use to maximize speed)
-m			:: generate full range spectrogram using all.log (this is the most useful thing)
-mr "52-1108,1248-1400,1900-2200"	:: set of frequency ranges to plot as a another spectrogram
These two scripts do fast scans within python from x to y frequency. Enabled it with -fast and make sure to set start and stop frequency with -f1 and -f2. Do not use -flist with this option.
$ while true; do perl radioscan_faster.pl -d2 /tmp/faster -f1 25 -f2 1700 -fast -g 30 -r 2400000 -s 1.2 -m -p; sleep 1; done;
Running graphfreq in non-batch fast mode 25 to 1700 Mhz at 1.2 Mhz spacings.
 Spectrograms and text output disabled.
Using LTE Cell Scanner to find frequency offset from 751 Mhz station...Found Rafael Micro R820T tuner
-44k frequency offset. Correcting -58 PPM.
Generating spectral map.

python ./graphfreqs_faster.py 40000000 2400000 30 -58 /tmp/faster 1700000000
Found Rafael Micro R820T tuner
... (repeat many, many times)
This is an example output "spectral map" (a spectrogram with a silly name).
 This example output above shows the overloading effects of using a wideband discone that picks up off-band noise. Each column is made up of small squares colored by intensity of the signal. Since the scripts start at the low frequency and sweep to high there is a small time delay between the bottom and top (see it more clearly zoomed in). And this is represented as the slant of the row. Sometimes strong signals will swamp out others resulting in discontinuities displaying as small dark vertical bands.
Or fast (-fast) scan a smaller range with smaller range (-f1,-f2: 24-80Mhz), with smaller samplerate (-r: 250 Khz) at smaller intervals (-s: 400Khz steps) with a gain of ~30. Only output a large spectrogram of all frequencies to the directory specified with -d2 as spectral-map.png. This example does not use frequency offset correct (-c) for even faster speeds.
This example output above shows the overloading effects of using a wideband discone that picks up off-band noise. Each column is made up of small squares colored by intensity of the signal. Since the scripts start at the low frequency and sweep to high there is a small time delay between the bottom and top (see it more clearly zoomed in). And this is represented as the slant of the row. Sometimes strong signals will swamp out others resulting in discontinuities displaying as small dark vertical bands.
Or fast (-fast) scan a smaller range with smaller range (-f1,-f2: 24-80Mhz), with smaller samplerate (-r: 250 Khz) at smaller intervals (-s: 400Khz steps) with a gain of ~30. Only output a large spectrogram of all frequencies to the directory specified with -d2 as spectral-map.png. This example does not use frequency offset correct (-c) for even faster speeds.
while true; do perl radioscan_faster.pl -d2 /home/superkuh/radio/2012-02-02_R820T_Discone_lowfreq -f1 24 -f2 80 -fast -g 30 -r 250000 -s 0.4 -m -p; sleep 1; done;
Running graphfreq in non-batch fast mode 24 to 80 Mhz at 0.4 Mhz spacings.
 Spectrograms and text output disabled.
Generating spectral map.

python ./graphfreqs_faster5.py 24000000 250000 30 0 /home/superkuh/radio/2012-02-02_R820T_Discone_lowfreq 80000000 400000
Found Rafael Micro R820T tuner
Exact sample rate is: 250000.000414 Hz
Combining multiple rtlsdr devices for greater speed
Full
Zoom
 By splitting up the spectrum into multiple smaller slices and giving them to multiple dongles the time required for one scan pass can be greatly improved. The above spectrogram is made with 2 dongles, one for the lower half and one for the upper. It is from ryannathans who also contributed the code for for specifying device ID. This is as simple as running the script twice but giving each instance a different "-dev" argument to specify device ID. You can run as many rtlsdr devices with my scripts as you wish (up to the USB and CPU limits). If they are using the same directory (-d2) their log data will be combined automagically for better coverage.
while true; do perl radioscan_faster.pl -d2 /home/superkuh/radio/2013-06-09_multidongle -f1 25 -f2 525 -fast -g 40 -r 2400000 -s 1.2 -m -dev 0; sleep 1; done;
...
Found Rafael Micro R820T tuner
while true; do perl radioscan_faster.pl -d2 /home/superkuh/radio/2013-06-09_multidongle -f1 525 -f2 1025 1100 -fast -g 29 -r 2400000 -s 1.2 -m -dev 1; sleep 1; done;
...
Found Elonics E4000 tuner
Outlier signals skewing your color map scale?
Sometimes I get corrupt samples that show a signal level of +60dB. These skew the scale of the output spectrograms. If I notice that they have occurred during a long run I'll use grep to find them and remove them manually. I replace the signal level with the level of the previous non-corrupt sample. In the future I'll build this kind of outlier removal in to the scripts, or sanity check before writing them.grep -rinP " (3|4|5|6)\d+\.\d+" *.logAll the incremental improvements in speed I've made above are okay but not very easy to maintain with multiple script types (bash/perl/python). I'm slowly putting together an Inline C based perl wrapper for exposing librtlsdr's functions within a perl script to write this as a standalone in perl. This is slow work because I've never done anything like it before.
rtlsdrperl - a perl wrapper for librtlsdr
I only have the most basic of basics fleshed out right now, but here's some example code. I would have never achieved even this simple task if not for the help I received from mucker on Freenode's #perl.#!/usr/bin/perl
use Inline C => DATA => LIBS => '-L/usr/local/lib/ -lrtlsdr -lusb';
use warnings;
use strict;
my $fuckingtest = get_device_name(0);
print "Device name: $fuckingtest\n";
my $fuckingtest2 = get_device_count();
print "# Devices: $fuckingtest2\n";
__END__
__C__
const char* rtlsdr_get_device_name(uint32_t index);
char * get_device_name(int count) {
char* res = rtlsdr_get_device_name(count);
return res;
}
uint32_t rtlsdr_get_device_count(void);
int get_device_count() {
int hem = rtlsdr_get_device_count();
return hem;
}
Older version
graphfreqs.py
You have to have the modified pyrtlsdr with the get/set functions for frequency correction. LTE Cell Scanner should also be installed so the "CellSearch" binary is available. Then download the two scripts above and put them in the same directory. For large bandwidths sampled this feature, ppm error correction, has an unnoticably small effect but I wanted to add it anyway. To call the spectrogram/log generator by itself for 431.2 Mhz at 2.4MS/s with a gain of 30 and frequency correction of 58 PPM use it like,python graphfreqs.py 431200000 2400000 30 58I've disabled the matplotlib (python) per frequency spectrogram plots for frequencies over 1 Ghz because there's not much going on up there. Also, the x-axis ticks and labels become inaccurate for some reason.
Logs and format
The signal strength logs, named by frequency (e.g. 53200000.log), use unix time and are comma seperated with newlines after each entry. In order of columns it is: unix time , relative signal level , gain in dB, PPM correction.1345667680.28 , -34.65 , 29 , 57 1345667955.59 , -34.67 , 29 , 57 1345668004.37 , -34.55 , 29 , 57 1345668110.06 , -33.88 , 29 , 57It also generates a log file with all frequencies for use with gnuplot, all.log. This file has unixtime first, then frequency, then gain and ppm error.
1347532002.5 52000000 -14.84 29.0 58
1347532004.88 53200000 -17.84 29.0 58
1347532007.04 54400000 -17.98 29.0 58
1347532009.04 55600000 -19.78 29.0 58
1347532011.02 56800000 -24.04 29.0 58
1347532012.98 58000000 -26.21 29.0 58
1347532014.92 59200000 -25.10 29.0 58
radioscan.pl
The radioscan.pl script is used to automate calling graphfreqs in arbitrary steps. To generate plots and signal strength for 52 Mhz to 1108 Mhz with a gain of 30, sample rate of 2.4MS/s, and an interval between center frequencies of 1.2 Mhz, call it like,$ perl radioscan.pl -flist "52-1108,1248-2200" -g 30 -r 2400000 -s 1.2
cli switches/options
-flist "52-1108,1248-2200"  :: sets of frequency ranges to scan.
-g 30			:: gain
-s 			:: interval between center frequencies
-r 2400000		:: sample rate
-d1 /path/here 		:: path to where the scripts are if now pwd
-d2 /path/here		:: path to the directory to put logs, plots, gallery
-c 751			:: LTC Cell scanner frequency offset correction, takes freq in Mhz of base cell
-w			:: turn on web gallery generation
-p			:: turn on gnuplot time series charts for every freq
-m			:: generate full range spectral map using all.log
-mr "52-1108,1248-1400,1900-2200"	:: set of frequency ranges to plot as a another spectral map
Because I can use the default directories I keep it running like the below, but anyone else should make sure to set -d2.
$ while true; do perl radioscan.pl -flist "52-1108,1248-2200" -g 30 -r 2400000 -s 1.2 -w -c 751 -p -m -mr "52-1108"; sleep 1; done;

Running pyrtl graphfreq batch job 52 to 1108 Mhz at 1.2 Mhz spacings.
Using LTE Cell Scanner to find frequency offset from 751 Mhz station...Found Elonics E4000 tuner
42.6k frequency offset. Correcting 56 PPM.
Generating spectral map.
Generating another spectral map over only 52-1108.

python ./graphfreqs_offset.py 52000000 2400000 30 56
Found Elonics E4000 tuner
python ./graphfreqs_offset.py 53200000 2400000 30 56
Found Elonics E4000 tuner
python ./graphfreqs_offset.py 54400000 2400000 30 56
Found Elonics E4000 tuner
...
python ./graphfreqs_gnuplot.py 316000000 2400000 30 56
Found Elonics E4000 tuner
Dongle froze, reseting it's USB device...
Resetting USB device /dev/bus/usb/001/017
Reset successful
python ./graphfreqs_gnuplot.py 317200000 2400000 30 56
Found Elonics E4000 tuner
..
Generating page, moving images.

starting rsync...
Tuner/USB freeze solution with unplugging
edit: as of Jan 5th 2013, librtlsdr has added soft reset functionality
Since graphfreqs.py's initializing and calling of rtl-sdr happens so frequently there are sometimes freezes. To fix these the USB device has to be reset. In the past I would accomplish this by un and re-plugging the cord manually. But that meant lots of downtime when I was away or sleeping. So, I've added in a small C program to the perl script using Inline::C that exposes a function, resetusb(). It is used if the eval loop around the graphfreqs call takes more than 10 seconds. This means you need Inline::C to run this script. To look at the original C version with a good explanation of how to use it click here.sub donglefrozen {
my $usbreset;
my @devices = split("\n",`lsusb`);
foreach my $line (@devices) {
if ($line =~ /\w+\s(\d+)\s\w+\s(\d+):.+Realtek Semiconductor Corp\./) {
$usbreset = "/dev/bus/usb/$1/$2";
resetusb($usbreset);
}}}
__END__
__C__
#include <stdio.h>
#include <unistd.h>
#include <fcntl.h>
#include <errno.h>
#include <sys/ioctl.h>
#include <linux/usbdevice_fs.h>

int resetusb(char *dongleaddress)
{
	const char *filename;
	int fd;
	int rc;
	filename = dongleaddress;
	fd = open(filename, O_WRONLY);
	if (fd < 0) {
		perror("Error opening output file");
		return 1;
	}
	printf("Resetting USB device %s\n", filename);
	rc = ioctl(fd, USBDEVFS_RESET, 0);
	if (rc < 0) {
		perror("Error in ioctl");
		return 1;
	}
	printf("Reset successful\n");
	close(fd);
	return 0;
}
My 11 GHz solar intensity interferometer that uses an rtlsdr receiver w/gnuradio

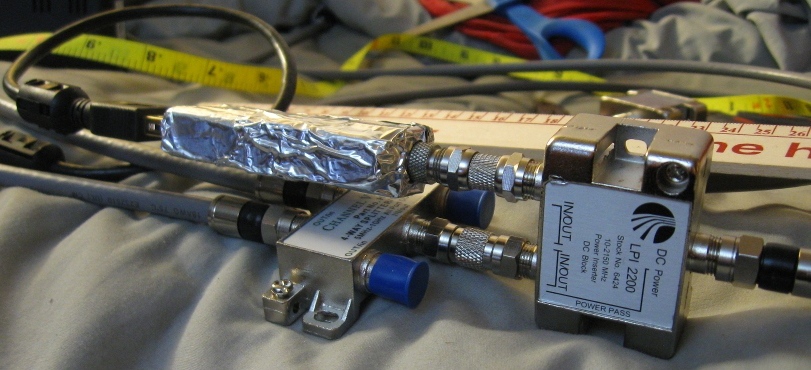
$75 2x 18" satellite dishes w/mounts shipped
$10 2x Ku LNFB (PLL321 S-2, ~30ppm error)
$20 rtlsdr receiver (e4k ezcap, ~30ppm error)
$15 power combiner (cheaper ones work too)
$5 coaxial power injector (LPI 2200)
$20 coaxial power supply (LPI 188PS) + diodes
$20 100ft RG6 quadshield + connectors

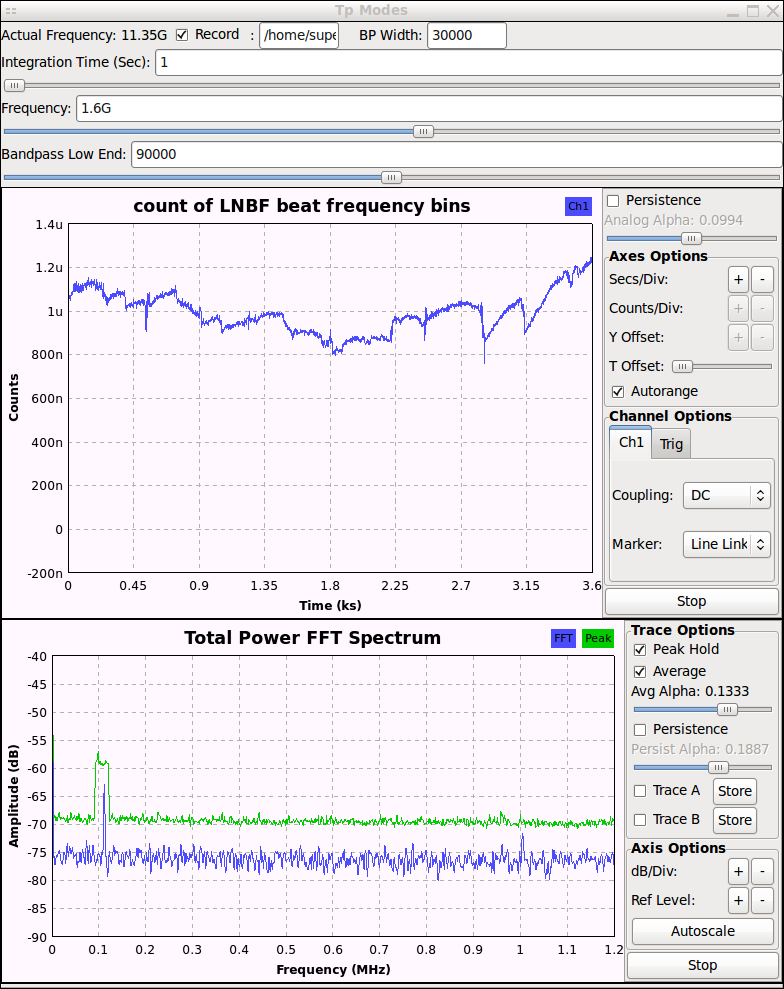
 The correlation is done with a regular satellite stripline power combiner at the intermediate frequency (IF, ~950-1950 MHz) and then an rtlsdr dongle is used to measure the total power of a 2.4 MHz bandwidth of the intermediate frequency range. I use a gnuradio-companion flowgraph to take the total power and then do a fourier transform of the total power. In this fourier transform the fringes show up as a modulation of the count in the FFT bins which correspond to the difference in frequency between the two downconverters. In my case this is about ~100 KHz.
In the Haystack VSRT memos a line drop amplifier, or two, are sometimes put behind the respective LNBF IF coax outputs or the power combiner. With the rtlsdr dongle and relative short (<10m) baselines of RG6 this isn't required.
The GUI allows for setting the exact 2.4 MHz bandwidth of the IF range to sample and the total power FFT bin bandpass to where and what the LNBF beat frequency is. The file name is autogenerated to the format,
The correlation is done with a regular satellite stripline power combiner at the intermediate frequency (IF, ~950-1950 MHz) and then an rtlsdr dongle is used to measure the total power of a 2.4 MHz bandwidth of the intermediate frequency range. I use a gnuradio-companion flowgraph to take the total power and then do a fourier transform of the total power. In this fourier transform the fringes show up as a modulation of the count in the FFT bins which correspond to the difference in frequency between the two downconverters. In my case this is about ~100 KHz.
In the Haystack VSRT memos a line drop amplifier, or two, are sometimes put behind the respective LNBF IF coax outputs or the power combiner. With the rtlsdr dongle and relative short (<10m) baselines of RG6 this isn't required.
The GUI allows for setting the exact 2.4 MHz bandwidth of the IF range to sample and the total power FFT bin bandpass to where and what the LNBF beat frequency is. The file name is autogenerated to the format,
prefix + datetime.now().strftime("%Y.%m.%d.%H.%M.%S") + ".log"
The time embedded in the filename is later used by a perl script, vsrt_log_timeplot.pl, which converts and metadata tags the binary records to gnuplot useable text csv format for making PNG plots.
The electronics and sofware sides are easy but manually repositioning the dishes swamps out the signal of interest. I'll try to follow the Haystack idea of two coupled Diseqc 1.2 compatible motor positioners mounted one on the other. In their design both dishes are mounted on a single PVC tube hooked to one of the positioners with a metal extension. My dishes can't rotate like theirs so I'll have to modify this design a bit. They use a serial relay to "push" the buttons on a physical Diseqc 1.2 motor controller remote. That seems a bit convoluted to me. I will buy a skystar2 (or hopefully cheaper) DVB pci card and under linux send raw Diseqc commands out by calling xdipo which accesses the linux DVB interface. Another alternative Diseqc motor controller would be using a 192 KHz USB soundcard and the DiSEqC Audio Generator software from Juras-Projects. Unfortunately the documentation for the hardware side of the audio generator is 404 now.
Download
Who else helped
 I consulted with patchvonbraun a lot for the software/gnuradio side. He game me the example of how to use the WX GUI Stripchart and I would not have guessed I needed to square the values from the beat frequency bins after the first squaring for taking total power. He made a generic simulator for dual free running clocks LNBF intensity interferometers. You don't even need to have an rtlsdr device to run it; only an up to date install of gnuradio. It is an easy way to understand how to do interferometry without a distributed clock signal.
patchvonbraun's: simulated-intensity-interferometer.grc
I consulted with patchvonbraun a lot for the software/gnuradio side. He game me the example of how to use the WX GUI Stripchart and I would not have guessed I needed to square the values from the beat frequency bins after the first squaring for taking total power. He made a generic simulator for dual free running clocks LNBF intensity interferometers. You don't even need to have an rtlsdr device to run it; only an up to date install of gnuradio. It is an easy way to understand how to do interferometry without a distributed clock signal.
patchvonbraun's: simulated-intensity-interferometer.grc
Physical
 With this setup on a 1 meter baseline and a intermediate tuning frequency of 1.6 GHz IF (10700 MHz+(1600 MHz−950 MHz)= 11350 MHz) then given 70*(c/11GHz)/1m)=1.9 degrees it is not possible to completely resolve the solar disk (~0.5 deg) during drift scans. I have been told that the magnitude goes down in a SINC pattern as you widen the baseline and approach resolving the source but I will not resolve the sun initially. Since total power measures the envelope of the In the VSRT Memos "Development of a solar imaging array of Very Small Radio Telescopes" a computationally complex way to resolve individual action regions is done with a 3rd dish providing "closure" in the array on a slanted north-south baseline in addition to the existing east-west baseline. I try to point my dishes so that the Earth is passing the sun through the beam at ~12:09pm (noon) each day. To aid in pointing a cross of reflective aluminum tape is applied center of the dish. This creates a cross of light on the LNBF feed when it is in the dish focal plane and the dish is pointed at the sun. The picture below is from later in the day, the one of the left shows the sun drifting out of the beam as it sets. I made my LNBF holders out of small pieces of wood compression fit in the dish arm. There are grooves for the RG6 coax to fit ground out with a rotary tool. The PVC collars have slots cut in the back with compression screws going into the wood to set the angle.

The screenshot shows a short run near sunset on an otherwise cloudy day. The discontinuities are me running outside and manually re-pointing the dishes. But it does highlight how the beat frequency of the 2 LNBF varies as they warm up when turned on. It starts down at ~90 KHz but within 10 minutes it rises to ~115 KHz. After it reaches equilibrium the variation is ~ -+1 KHz. I could change the existing 80-120 KHz bandpass to a 110-120 KHz bandpass and have better sensitivity. But that bandwidth is something that has to be found empirically with each LNBF pair and set manually within the GUI for now. patchvonbraun said it was feasible to identify the frequency bins with the most counts and that there was an example within the simpla_ra code, "You could even have a little helper function, based on a vector probe, that finds your bin range, and tunes the filter appropriately." The below close up of indoor testing showing how everything is connected on the rtlsdr side showing the power injector, e4k based rtlsdr (wrapped in aluminum tape), and the stripline based satellite power combiner for correlation. The two rg6 quadshield coaxial lines going from the power combiner to the ku band LNBF are as close to the same length as I could trim them. I use a 1 amp 18v power supply and coaxial power injector to supply power to the LNB and any amplifiers. This voltage controls linear polarization (horiztonal/vertical) and it can be changed by putting a few 1 amp 1N4007 in series with the power line to drop the voltage.
Software
tp-modes.grc produces binary logs that are pretty simple. The count of the LNBF beat frequency bins in the bandpass are saved as floats represented as 4 pairs of hexadecimal. When the integration time is set to the default 1 second then one 4 byte data point is written to the log every 0.5 seconds. I highly recommend not changing this for now. There is no metadata or padding. Here's a screenshot of a run using the utility "bless",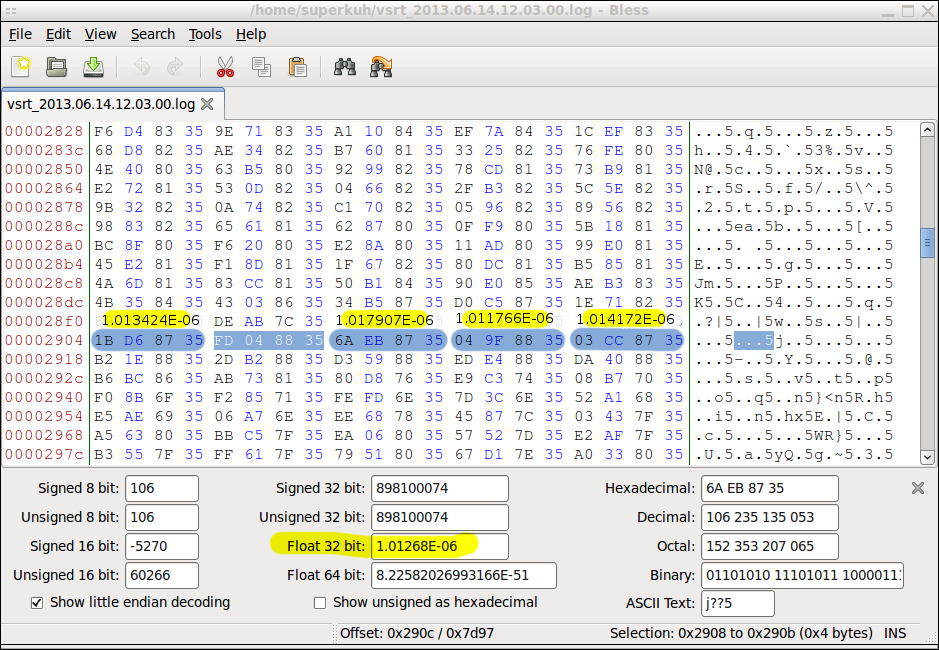 In order to convert the binary logs of 4 byte records into something gnuplot can parse I use a simple perl script,
#!/usr/bin/perl
use warnings;
use strict;

my $data = '/home/superkuh/vsrt_2013.06.13.12.26.47.log';
my $bytelength = 4;
my $format = "f"; # floats (little endian)
my $num_records;

if ($ARGV[0]) {
	$data = $ARGV[0];
} else {
	print "you need to pass the log file path as an argument.";
	exit;
}

open(LOG,"$data") or die "Can't open log.\n$!";
binmode(LOG);

my $i = 0;
until ( eof(LOG) ) {
	my $record;
	my $decimal;
	read(LOG, $record, $bytelength) == $bytelength
		or die "short read\n";
	$decimal = unpack($format, $record);
	printf("$i,\t$decimal\n", $decimal);
	$i++;
}
Now I have the filename which gives the time the gnuradio-companion grc file started running. This is not the time I hit the record button and started logging. The offset is a second or two. Ignoring that, it is possible to use the start time encoded in the log file name to figure out when a particular measurement was taken. To do that I have to know the interval between entries saved to the binary log.
$ date && ls -l /home/superkuh/vsrt_2013.06.14.12.03.00.log && sleep 60 && date && ls -l /home/superkuh/vsrt_2013.06.14.12.03.00.log
Fri Jun 14 13:05:24 CDT 2013
-rw-r--r-- 1 superkuh superkuh 29644 2013-06-14 13:05 /home/superkuh/vsrt_2013.06.14.12.03.00.log
Fri Jun 14 13:06:24 CDT 2013
-rw-r--r-- 1 superkuh superkuh 30124 2013-06-14 13:06 /home/superkuh/vsrt_2013.06.14.12.03.00.log

((30124−29644)/4)/60 = 2

$ date && ls -l /home/superkuh/vsrt_null.log && sleep 60 && date && ls -l /home/superkuh/vsrt_null.logFri Jun 14 13:44:36 CDT 2013
-rw-r--r-- 1 superkuh superkuh 8 2013-06-14 13:44 /home/superkuh/vsrt_null.log
Fri Jun 14 13:45:36 CDT 2013
-rw-r--r-- 1 superkuh superkuh 488 2013-06-14 13:45 /home/superkuh/vsrt_null.log

((488−8)/4)/60 = 2
To know what time a log record corresponds to, take the time from the filename and then add 0.5 seconds * the index of the 4 byte entry in the binary log. This should be possible to write into the until loop so it outputs time instead of just index $i. The below example is a hacky version of my log parser that does just this. Here's an example output.
# UTC Epoch	# Beat Freq Bins
1371229380.0,	1.38292284646013e-06
1371229380.5,	1.37606230055098e-06
1371229381.0,	1.374015937472e-06
1371229381.5,	1.366425294691e-06
1371229382.0,	1.35845414206415e-06
1371229382.5,	1.36476899115223e-06
1371229383.0,	1.36480070977996e-06
1371229383.5,	1.36444589315943e-06
1371229384.0,	1.35775212584122e-06
1371229384.5,	1.36395499339415e-06
1371229385.0,	1.35322613914468e-06
1371229385.5,	1.36412847950851e-06
1371229386.0,	1.36531491534697e-06
1371229386.5,	1.3664910056832e-06
1371229387.0,	1.36144888074341e-06
1371229387.5,	1.35596496875223e-06
1371229388.0,	1.35830066483322e-06
1371229388.5,	1.3654090480486e-06
1371229389.0,	1.358990175504e-06
1371229389.5,	1.37098015784431e-06
1371229390.0,	1.387945303577e-06
1371229390.5,	1.38286770834384e-06
1371229391.0,	1.36734763600543e-06
1371229391.5,	1.36036248932214e-06
...
#!/usr/bin/perl
use DateTime;
use warnings;
use strict;

# The simplest possible gnuplot plot using this program's output.
# ./vsrt_log_timeplot.pl /home/superkuh/vsrt_2013.06.14.12.03.00.log > whee2.log
# gnuplot> plot "./whee2.log" using 1:2 title "VSRT Test" with lines

my $data = '/home/superkuh/vsrt_2013.06.13.12.26.47.log';
my $bytelength = 4;
#my $format = "V"; # oops, not this unsigned 32 bit (little endian)
my $format = "f"; # float
my $num_records;

if ($ARGV[0]) {
	$data = $ARGV[0];
} else {
	print "you need to pass the log file path as an argument.";
	exit;
}

my $dt; # declare datetime variable globally
extracttime($data); # $dt now has date object.

open(LOG,"$data") or die "Can't open log.\n$!";
binmode(LOG);

my $i = 0;
until ( eof(LOG) ) {
	my $record;
	my $decimal;
	read(LOG, $record, $bytelength) == $bytelength
		or die "short read\n";

	$decimal = unpack($format, $record);

	# This is a stupid/fragile way to deal with datetime
	# not having enough precision. It only works if the
	# record to record interval is always 0.5 seconds.
	my $recordtime = $dt->epoch();
	if (0 == $i % 2) {
		printf("$recordtime.0,\t$decimal\n", $decimal);
	} else {
		printf("$recordtime.5,\t$decimal\n", $decimal);
	}

	$dt->add( nanoseconds => 500000000 );
	$i++;
}

sub extracttime {
	my $timestring = shift;
	# /home/superkuh/vsrt_2013.06.13.12.26.47.log
	$timestring =~ /(\d{4}\.\d{2}\.\d{2})\.(\d\d\.\d\d\.\d\d)/;
	my $year_month_day = $1;
	my $time = $2;

	my ($year,$month,$day) = split(/\./, $year_month_day);
	$time =~ s/\./:/g;
	my ($hour,$minute,$second) = split(/:/, $time);

	$dt = DateTime->new(
		year       => $year,
		month      => $month,
		day        => $day,
		hour       => $hour,
		minute     => $minute,
		second     => $second,
		time_zone  => 'America/Chicago',
	);

	$dt->set_time_zone('UTC');
	return 1;
}
Now I just have to make up a good gnuplot format and integrate the calls into the perl script.
But where are the fringes?!
Okay, I admit it. I don't have any yet. I'm getting there, though. Anyway, when I get all the software written and do start getting multiday averaged data and piping it into gnuplot this what I might see with respect to fringe modulation of counts in the FFT beat frequency bins.70*(c/11GHz)/1m) = 1.9 degree ~3dB beamwidth (15 deg/hour)/(1.9 deg) = 7.9/hour (7.9/hour)/(60 min/hour) = 0.132 fringe/minuteThat doesn't resolve the sun and I'll need to expand my baseline to ~4m sometime.
70*(c/11GHz)/4m) = 0.48 degree ~3dB beamwidth
(15 deg/hour)/(0.48 deg) = 31.25/hour
(31.25/hour)/(60 min/hour) = 0.52 fringe/minute
Decoding Pager Data with multimon and/or gnu radio receivers
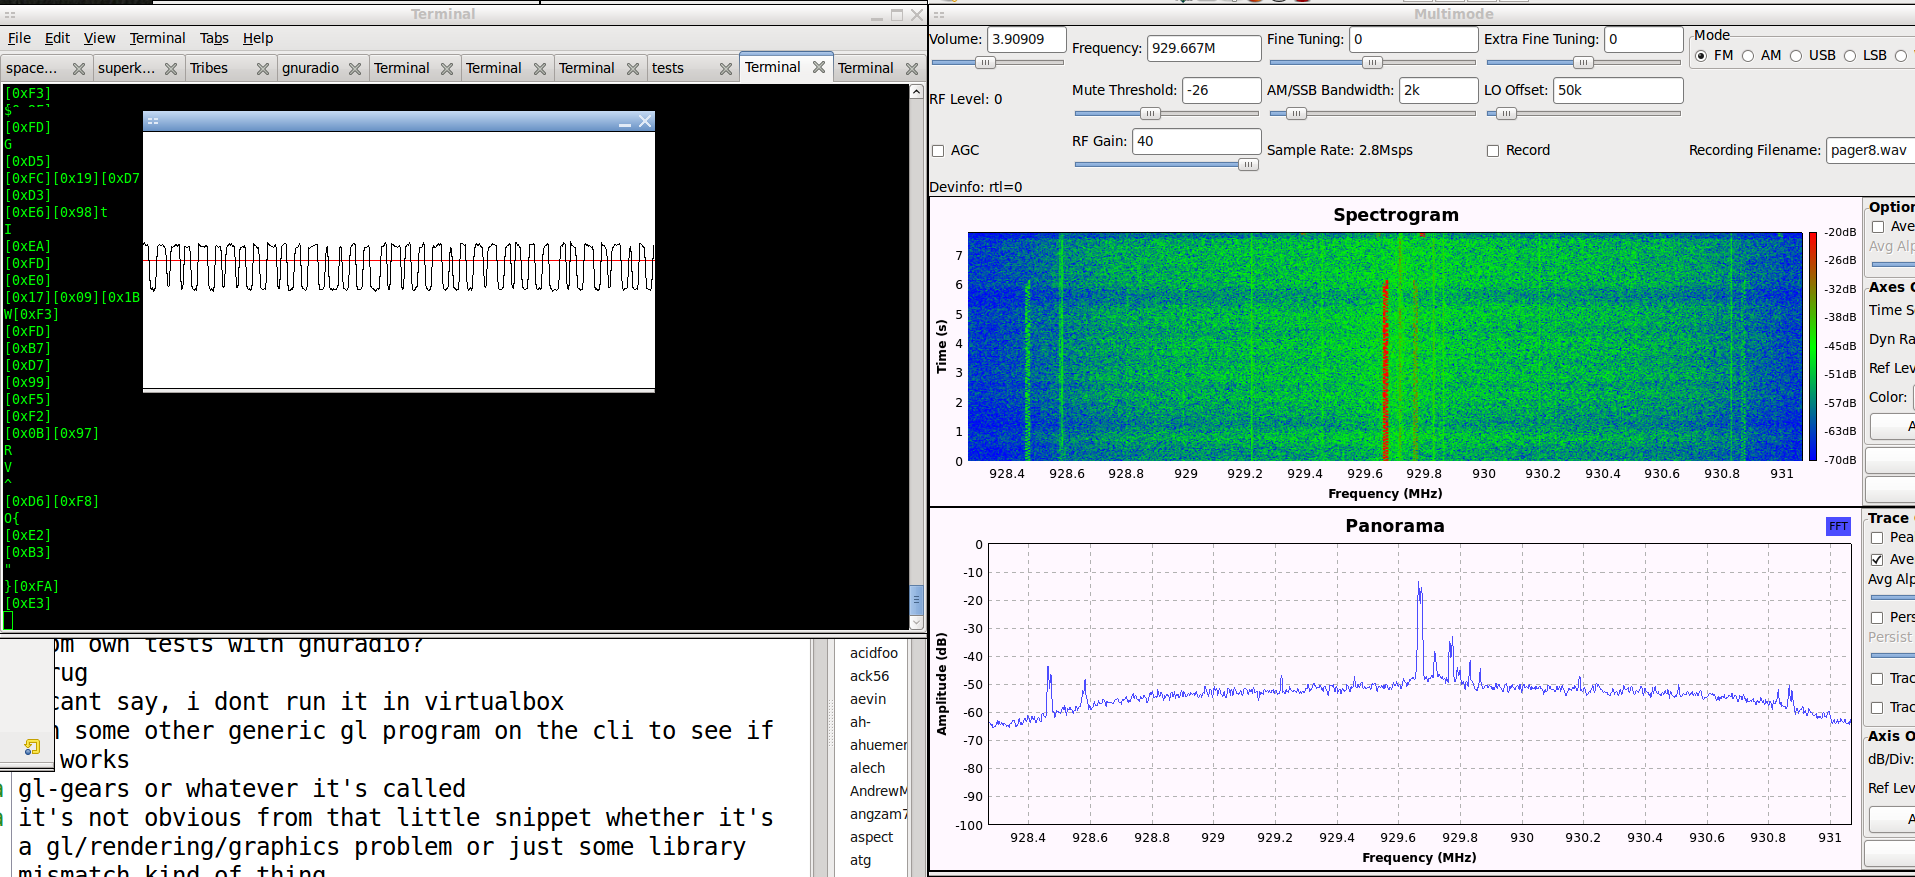 The hardest part of this is figuring out what kind of pager system you have. I spent a long time trying to decode the local FLEX pager system with decoders that did not support it.
Written by Thomas Sailer, HB9JNX/AE4WA, multimon (multimon.tar.bz2) supports decoding a large number of pager modulations. FLEX is not one of them. Scroll down for FLEX.
On June 29th 2012 dekar told me about his updated fork of multimon, multimonNG, with better error correction and more modulations supported. As of right this instant those on 64bit linux should just use the existing makefile and *not* qmake or qt-creator to compile it. For the windows users (or anyone wanting more info) there's a precompiled version and blog post. Make sure to disable all the demodulators you don't need. I think especially ZVEI is quite spammy. This andthis is what pocsag sounds like if you're wondering.
When I originally started playing and wrote this there were only a couple options for rtlsdr receivers to use with the multimon decoder. I used patchvonbraun's multimode to save .wavs and dekar's pager example GRC I modified for OsmoSDR sources linked below for raw, real time decoding. Lately (as of late 2012/13) a large number of receivers have been released that don't depend on GNU Radio. rtl_fm is one and there's an example usage below.
The hardest part of this is figuring out what kind of pager system you have. I spent a long time trying to decode the local FLEX pager system with decoders that did not support it.
Written by Thomas Sailer, HB9JNX/AE4WA, multimon (multimon.tar.bz2) supports decoding a large number of pager modulations. FLEX is not one of them. Scroll down for FLEX.
On June 29th 2012 dekar told me about his updated fork of multimon, multimonNG, with better error correction and more modulations supported. As of right this instant those on 64bit linux should just use the existing makefile and *not* qmake or qt-creator to compile it. For the windows users (or anyone wanting more info) there's a precompiled version and blog post. Make sure to disable all the demodulators you don't need. I think especially ZVEI is quite spammy. This andthis is what pocsag sounds like if you're wondering.
When I originally started playing and wrote this there were only a couple options for rtlsdr receivers to use with the multimon decoder. I used patchvonbraun's multimode to save .wavs and dekar's pager example GRC I modified for OsmoSDR sources linked below for raw, real time decoding. Lately (as of late 2012/13) a large number of receivers have been released that don't depend on GNU Radio. rtl_fm is one and there's an example usage below.
real time decoding rtl_fm
rtl_fm -f 930.353e6 -g 100 -s 22050 -l 310 - |multimon -t raw -a POCSAG512 -a POCSAG1200 -a POCSAG2400 -f alpha /dev/stdin
real time decoding w/dekar's pager_fifo
Dekar's multimonNG, a fork with improved error correction, more supported modes, and *nix/osx/windows support. In the screenshots below the signal is not pocsag. I thought it might be zwei but now I'm not so sure it's even pager data. Test samples of pocsag that Dekar links on his blog decode just fine.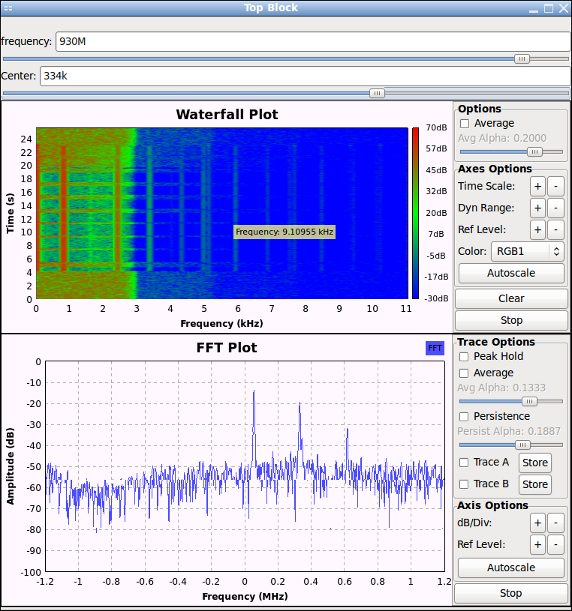 pager_fifo_web.grc
mkfifo /tmp/pager_fifo.raw
./multimonNG -t raw /tmp/pager_fifo.raw
gnuradio-companion pager_fifo_web.grc
In order to decode the pager data in real time you should use a first-in first-out file (fifo). Dekar's pager_fifo is designed to do that but you'll need to set the correct file paths for the File Sink yourself. In the copy downloadable here the File Sink's path is set to "/tmp/pager_fifo.raw". You should be able to run it without editing once you've made that fifo. Make sure to start multimon reading the fifo before you begin GRC and execute the receiver.
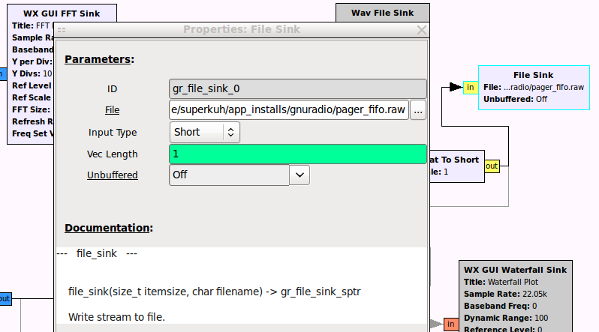 In my personal copy of dekar's pager_fifo the file and audio sinks are enabled while the waterfall, wav, and other sinks are disabled. To enable the disabled (grey) block select them and press 'e' ('d to disable). The audio sink is set to pulseaudio ("pulse").

FLEX Pagers
Unfortunately it turned out my local pagers were all using FLEX, and so not supported by any of the above software. But the procedures might still be useful for someone. Decoding FLEX can be done with the software PDW, but it is windows only. In GNU Radio there is additionally gr-pager, which is supposed to support flex, but many implementation scripts for it are GNU Radio 3.6.5 or older and getting stuff to work with 3.7 requires namespace changes. mothran's flex_hackrfis one of these. Since the rtlsdr receivers can but shouldn't do 3.125 MS/s, like flex_hackrf of uhd_flux, what they use natively for the bandwidth, and so decimation, and pretty much everything else have to be re-written too. I've attempted to start this and you can see a copy here. A couple days after I wrote the above paragraph zarya came on ##rtlsdr on freenode and mentioned his rtlsdr supprting FLEX decoder written months before. It is easy to use and works great! This script runs at a 250 KS/s sample rate and decodes 12.5 KHz channel only. Internally it uses gnuradio's optfir to generate low pass taps that wide to use witih a frequency xlating FIR filter. It then passes that to gr-pager's flex_demod. later: argilo (Clayton Smith) has also put together an osmosdr source based gr.pager flex decoder for his GNU Radio tutorial series. The below output is heavily censored and edited to avoid disclosing or reproducing sensitive information but it gives you an idea of the type of messages.git clone https://github.com/zarya/sdr cd sdr/receivers/flex/ ./rtl_flex_noX.py -f 929.56M --rx-gain=37.2 linux; GNU C++ version 4.6.3; Boost_104800; UHD_003.005.004-149-gc357a16e No database support gr-osmosdr v0.1.0-33-g8facbbcc (0.1.1git) gnuradio 3.7.2git-123-g0ded5889 built-in source types: file fcd rtl rtl_tcp uhd hackrf netsdr Using device #0 Generic RTL2832U SN: 77771111153705700 Found Rafael Micro R820T tuner Exact sample rate is: 250000.000414 Hz Setting gain to 20.700000 (from [0.000000, 49.600000]) Using Volk machine: avx_64_mmx_orc 0 929.560| 55|SPN|2900 0 929.560| 5555555|ALN|osoft JDBC type 4 driver for MS SQL Server 2005:FreePoolSize = 24 [03] 0 929.560| 555|ALN|MSN 020 hello Message from NOC PCB. 129 0 929.560| 5555555|ALN| Task: 3322391 Net: 0 Pressman: REDACTED, REDACTED Click here to view the curre [28] 0 929.560| 555555555|ALN|4.Q!T .(-RS(7+*# ~A-!lu+3L:REDACTED:YSGO>T JL*qN>][WOA"$(0?"$8QB, 33*dM:YSG.>][WO<]\(0BK [1 0 929.560| 5555555|ALN|From: REDACTED@REDACTED.com Subject: REDACTED scheduled report: "05:00 Medication Devices" - Scheduled report "05:00 Medication Devices" was sent by REDACTED. <> [43] 0 929.560| 5555555|ALN|re| 7291 W 190th St| FD o/s calling a 2nd alarm for a structure fire, Setting up water supply| REDACTED008| 05:02 . . [97] 0 929.560| 5555555|ALN|Fr/m: 7th.Floor-.REDACTED REDACTED: +Blood Cultures; G+ cocci from yesterday's clinic draw. On Cefepime. Afebrile. New orders? Draw BCs in am? [31] 0 929.560| 5555555|SPN|766087U410 5[[[ 0 929.560| 5555555|ALN|REDACTED, REDACTED 9105-2 FYI: Notified by lab stool sample came back positive of C.diff Liculda, RN REDACTED c9q [74]..I tried for over a year before successfully decoding local pager signals. Now that I have I think it is a bad idea. There is far much too much private information in cleartext. I don't plan to try again.
(old) gqrx install notes
 Read this person's guide instead.
When I wrote this up the original version by csete didn't support the hardware yet but mathis_, phirsch, Hoernchen, and perhaps others I've missed from ##rtlsdr on freenode had added librtlsdr support to gqrx; their repos are still listed by commented out. These days csete has added in rtlsdr support so you can use his original repository.
Read this person's guide instead.
When I wrote this up the original version by csete didn't support the hardware yet but mathis_, phirsch, Hoernchen, and perhaps others I've missed from ##rtlsdr on freenode had added librtlsdr support to gqrx; their repos are still listed by commented out. These days csete has added in rtlsdr support so you can use his original repository.
[an error occurred while processing the directive]
git clone https://github.com/csete/gqrx.git
cd gqrx
# on Ubuntu, sudo apt-get install qtcreator , if you don't have it.
qtcreator gqrx.pro 	# press the build button (the hammer)
# Avoid qtcreator doing it manually.
qmake
make

./gqrx
Use with Ubuntu 10.04 and distros with old Qt < 4.7
You will almost certainly not get this error. But, someone might, so I'm leaving it here to be indexed. If you're like me and run an older distribution then your Qt libraries will be out of date and lack a function required for generating the name of the files to be saved when recording./home/superkuh/app_installs/gnuradio/gqrx/gqrx/qtgui/dockaudio.cpp:100: error: ‘currentDateTimeUtc’ is not a member of ‘QDateTime’Initially I thought it was a qtcreator thing so I tried to get more information by doing it manually, qmake make g++ -c -pipe -O2 -I/usr/local/include/gnuradio -I/usr/local/include -I/usr/local/include -I/usr/local/include/gnuradio -D_REENTRANT -D_REENTRANT -I/usr/include/libusb-1.0 -Wall -W -D_REENTRANT -DQT_NO_DEBUG -DQT_NO_DEBUG_OUTPUT -DVERSION="\"0.0\"" -DQT_NO_DEBUG -DQT_GUI_LIB -DQT_CORE_LIB -DQT_SHARED -I/usr/share/qt4/mkspecs/linux-g++ -I. -I/usr/include/qt4/QtCore -I/usr/include/qt4/QtGui -I/usr/include/qt4 -I. -I. -o dockaudio.o qtgui/dockaudio.cpp qtgui/dockaudio.cpp: In member function ‘void DockAudio::on_audioRecButton_clicked(bool)’: qtgui/dockaudio.cpp:100: error: ‘currentDateTimeUtc’ is not a member of ‘QDateTime’ make: *** [dockaudio.o] Error 1 To get it to compile on these systems you'll have to do the below. (edit: This little change is now added into phirsch's.) Ubuntu 10.04 has old Qt libs and gqrx uses a function call not in them. So, while I was waiting for Qt 4.74 to compile I decided to try a hack. I removed that function call with a static string of text. [edit] I later found comparable functions for Qt 4.6 and older. If you are using qtcreator like the docs suggest you can double click on the error and go to the line. If not, it was in ./Sources/qtgui/dockaudio.cpp replace,
void DockAudio::on_audioRecButton_clicked(bool checked)
{
    if (checked) {
        // FIXME: option to use local time
        lastAudio = QDateTime::currentDateTimeUtc().toString("gqrx-yyyyMMdd-hhmmss.'wav'");
With something like this.
void DockAudio::on_audioRecButton_clicked(bool checked)
{
    if (checked) {
        // FIXME: option to use local time
        // use functions compatible with older versions of Qt.
        lastAudio = QDateTime::currentDateTime().toUTC().toString("gqrx-yyyyMMdd-hhmmss.'wav'");
And it'll compile and run correctly on my specific machine.
Compiling LTE Cell Scanner and LTE Tracker on Ubuntu 10.04
Before starting make sure to have a fortran compiler, FFTW, BLAS, and LAPACK libraries installed from the repositories.sudo apt-get install automake autoconf libtool libfftw3-3 libfftw3-dev gfortran libblas3gf libblas-dev liblapack3gf liblapack-dev libatlas-base-devIf you're using 12.04 just follow the instructions on the github page and everything is trivial. For 10.04 (lucid) users the the initial hurdle is cmake. LTE Cell Scanner requires cmake 2.8.8 and Ubuntu 10.04 only has 2.8 the finding of BLAS and LAPACK libraries will fail like,
CMake Error at CMakeLists.txt:1 (CMAKE_MINIMUM_REQUIRED):
  CMake 2.8.4 or higher is required.  You are running version 2.8.0.
Until you open CMakeList.txt and change the version number on first line to 2.8.0. After fixing that the BLAS and LAPACK issues come in,
cmake ..
-- Found ITPP: /usr/lib64/libitpp.so
CMake Error at /usr/share/cmake-2.8/Modules/FindBLAS.cmake:45 (message):
  FindBLAS is Fortran-only so Fortran must be enabled.
Call Stack (most recent call first):
  CMakeLists.txt:29 (FIND_PACKAGE)
You can see my installation notes before I figured it out. To fix it I searched for people complaining of similar problems on other projects and then replaced my *system* files with theirs, FindBLAS.cmake.
sudo cp /usr/share/cmake-2.8/Modules/FindBLAS.cmake /usr/share/cmake-2.8/Modules/FindBLAS.cmake.bak
sudo cp FindBLAS.cmake /usr/share/cmake-2.8/Modules/
LAPACK will also fail this way. I used this arbitray cmake file,http://code.google.com/p/qmcpack/source/browse/trunk/CMake/FindLapack.cmake?r=5383. And this is a local backup in case that disappears.
sudo cp /usr/share/cmake-2.8/Modules/FindLAPACK.cmake /usr/share/cmake-2.8/Modules/FindLAPACK.cmake.bak
sudo FindLAPACK.cmake /usr/share/cmake-2.8/Modules/FindLAPACK.cmake
After fixing the cmake issues compile and install the latest IT++ (ITPP 4.2). Make sure to completely remove the old ITPP 4.0.7 libraries from the Ubuntu repository. When LTE Cell scanner compiles you can go back and restore the .bak cmake files. The rate of scan is about 0.1 Mhz per 10 seconds.
./CellSearch -v -s 751e6 -e 751e6
LTE CellSearch v0.1.0 (release) beginning
  Search frequency: 751 MHz
  PPM: 100
  correction: 1
Found Elonics E4000 tuner
Waiting for AGC to converge...
Examining center frequency 751 MHz ...
Capturing live data
  Calculating PSS correlations
  Searching for and examining correlation peaks...
  Detected a cell!
    cell ID: 414
    RX power level: -17.0733 dB
    residual frequency offset: 43592.8 Hz
  Detected a cell!
    cell ID: 415
    RX power level: -20.8041 dB
    residual frequency offset: 43592.3 Hz
  Detected a cell!
    cell ID: 209
    RX power level: -28.8524 dB
    residual frequency offset: 43581.2 Hz
Detected the following cells:
C: CP type ; P: PHICH duration ; PR: PHICH resource type
CID      fc   foff RXPWR C nRB P  PR CrystalCorrectionFactor
414    751M  43.6k -17.1 N  50 N one 1.0000580496943698439
415    751M  43.6k -20.8 N  50 N one 1.0000580490797574829
209    751M  43.6k -28.9 N  50 N one 1.0000580342133056355
Both positive and negative frequency offsets happen, but rarely in the same dongle. LTE Tracker I haven't used as much yet (recently released) but it is included in the github repository cloned initially and should be compiled as well if you did the above. Check out the authors site for videos of it's use since an ascii paste of the ncurses like interface wouldn't tell you much. But... the start looks like this,
./LTE-Tracker -f 751e6
LTE Tracker v1.0.0 (release) beginning
  Search frequency: 751 MHz
  PPM: 120
  correction: 1
Found Rafael Micro R820T tuner
Calibrating local oscillator.
Calibration succeeded!
   Residual frequency offset: -48937.5 Hz
   New correction factor: 0.99993484110674779597
Searcher process has been launched.
Slightly altered GNU Radio Companion flowcharts
"The GUI stuff in Gnu Radio was rather an afterthought. Nobody really expected that you'd use it to build actual applications, but rather just use it as a way of making "test jigs" for your signal flows." This section is my notes on how I made basic examples work, and how I edited those examples in very simple and often broken ways. Also, since gqrx, multimode, and other intergrated receivers came out I don't see any need to update these as things change. Most of this is very old. While there are links to the originals in the summaries, these descriptions are of the versions modified by me; usually just sample rate and GUI stuff. While the sample rate or tuner width I set may be some large number, it'll become obvious what the limits of each other as you scan about and see the signal folding or mirroring. Using sample rates above 2.4 MS/s with rtlsdr is not recommended. It *does* create aliases all over. If you're using GNU Radio 3.7 don't even bother trying with any .grc files hosted here.- FM:
- patchvonbraun's simple (stereo) fm receiver - harder setup, best reception, best sound, 2.048 MS/s, +-600Khz fine tune
- lindi's fm receiver easy setup, good reception, good sound, 3.2 MS/s, +-600Khz fine tune
- superkuh's offset fm receiver - easy setup, okay reception, okay sound, 2.8 MS/s, +-900Khz tune, +-50Khz fine.
- 2h20's beginner fm (mono) receiver - easy to understand, easy setup, okay sound, 2.8 MS/s, no fine tune
- SSB:
- OZ9AEC's SSB Receiver - SSB rx and record to disk, seperate playback script. 1 MS/s, +-1k fine tune.
Tips
If it comes with a python file, try that first before generating one from the GRC file. When tuning, make sure to hit enter again if it doesn't work the first time or tunes to the wrong frequency. Always hit autoscale to start, and for FFT displays try using the "average" settings. I have set all audio sinks to "pulse" (pulseaudio) instead of say, "hw:0,0" (ALSA). You might have to change that. To get a list of hardwareuse "aplay -l". That'll show the various cards and devices. Use the format, "hw:X,Y" where "hw:CARD=X,DEV=Y". Some flowcharts have variables for it, others put it directly in the Audio Sink element. If you hear something interesting you can try comparing it to indentified samples from http://www.kb9ukd.com/digital/ or http://hfradio.org.uk/html/digital_modes.html. or the windows program, Signals Analyzer. Check http://www.radioreference.com/ or http://wireless2.fcc.gov/UlsApp/UlsSearch/searchAdvanced.jsp to see what's in the USA area at a given frequency.Multiple Dongles
There are two ways to specify the use of multiple dongles. The first, correct, way is to set the "Num Channels" in the OsmoSDR Source block to "2" and then specify the device IDs in "Device Arguments" like, "rtl=0 rtl=1". Each specified device is seperate with a space from the previous one. The not so correct but still working way is to use multiple OsmoSDR Source blocks with "Num Channels" set to "1" and each with it's respective "Device Arguments" field set to "rtl=0" or "rtl=1", or so on. The OsmoSDR Source block has extensive help files at the bottom of it's properties if you scroll down.Editing
To enable a block, select it and press 'e'. To disable a block select it and press 'd'. When disabled blocks will appear darker gray. If you open a .grc file and it looks like there are blocks missing (red error highlights and no connections between them) then it is likely the name of the block changed during some GNU Radio update. If your install is more than a month or two old this often happens. Update GNU Radio. It's easier to type in 1e6 than 1000000 so use scientific notation when you can in variable fields. If you double click on an element in a flowchart it usually includes a helpful "Documentation:" of most the variables to be set at the bottom. The GUI element grid position is a set of two pairs of numbers: "y,x,a,b" where the first pair "y,x," is position (y row, x column) and "a,b" is the span of the box. If you enter a Grid Position and it overlaps with another element it'll turn red and report the error and where the origin is of the element it overlaps with.Use the Grid Position (row, column, row span, column span) to position the graphical element in the window.The tab effect is done with notebooks.
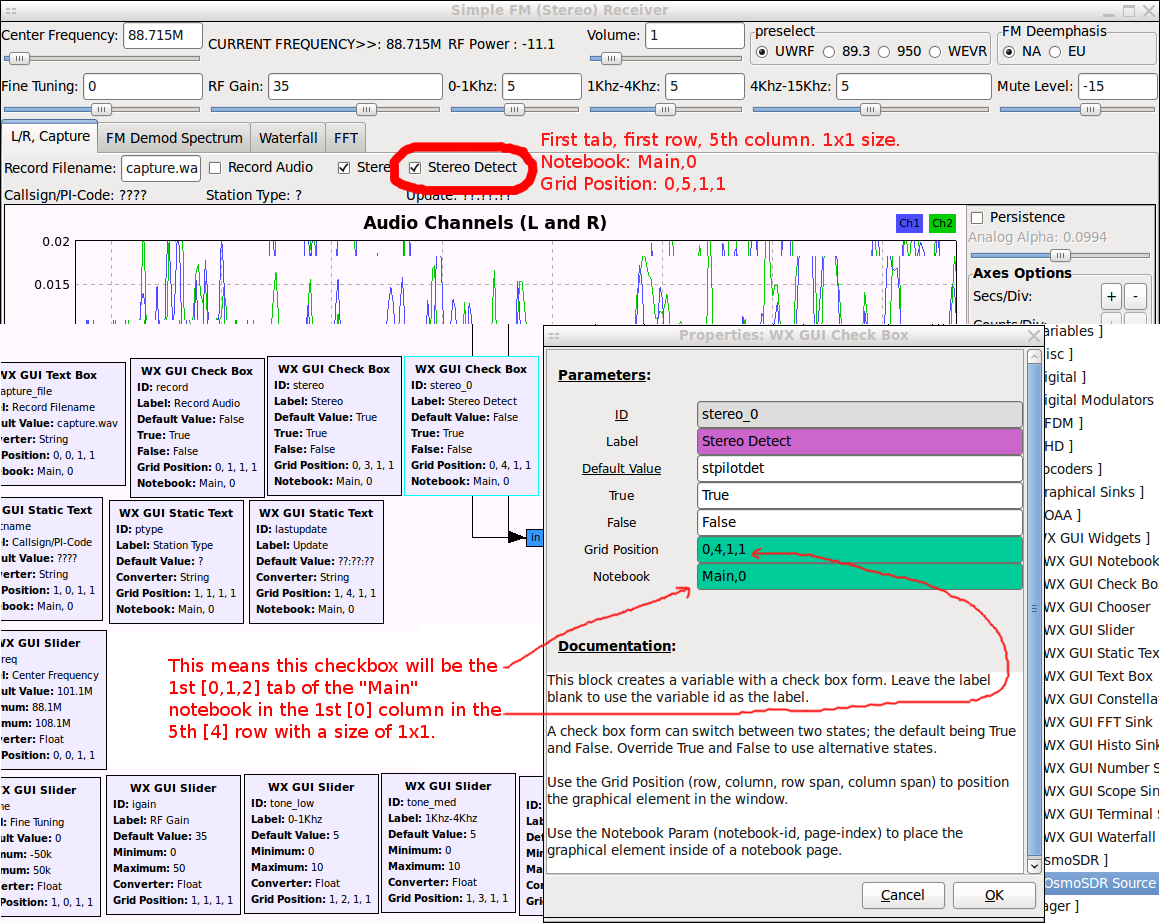 For RTL2832 Source the minimum sample rate is ~800KS/s, it's gr-baz(?) and generally not updated. Use OsmoSDR source. It's under "OsmoSDR", not "Sources" on the right panel). It has a 1MS/s minimum sample rate. It's not recommended to use sample rates above 2.4M.
In older versions of gr-osmosdr and rtl-sdr I think automagic gain control (AGC) was on all the time so you didn't have to set the gain explicitly in the source in GRC. New versions require that and also require setting the chan 0. freq to something.
The dongles seem to have noise at their 0Hz center frequency so the best performance is from selecting a band 100-200Khz offset from the center (depending on signal type). patchvonbraun's simple_fm_rcv is a great example of that.
For RTL2832 Source the minimum sample rate is ~800KS/s, it's gr-baz(?) and generally not updated. Use OsmoSDR source. It's under "OsmoSDR", not "Sources" on the right panel). It has a 1MS/s minimum sample rate. It's not recommended to use sample rates above 2.4M.
In older versions of gr-osmosdr and rtl-sdr I think automagic gain control (AGC) was on all the time so you didn't have to set the gain explicitly in the source in GRC. New versions require that and also require setting the chan 0. freq to something.
The dongles seem to have noise at their 0Hz center frequency so the best performance is from selecting a band 100-200Khz offset from the center (depending on signal type). patchvonbraun's simple_fm_rcv is a great example of that.
patchvonbraun's simple_fm_rcv
The best sounding software I've found for listening to FM is patchvonbraun's Simple FM (Stereo) Receiver. I don't think it is very simple; it includes many advanced FM specific features like extraction of the 19k (pilot) tone next to some commercial FM broadcasts. It used to do RDS, I hear, and older versions checked into CGRAN still have it, but it is removed for simplicitly in this version.svn co https://www.cgran.org/svn/projects/simple_fm_rcv cd simple_fm_rcv/ cd trunk less README make make install ## it'll install to ~/bin/, so I use ~/superkuh/bin below set PYTHONPATH=/usr/local/lib/python2.6/dist-packages:/home/superkuh/bin # run the python script python simple_fm_rcv.py # or edit it gnuradio-companion simple_fm_rcv.grc
lindi's FM receiver
Original: http://lindi.iki.fi/lindi/gnuradio/rtl2832-cfile-lindi-fm.grc , this was an example posted to ##rtlsdr by lindi. It used a file source which was decoded to wav and saved to disk. Seen in the screenshot above.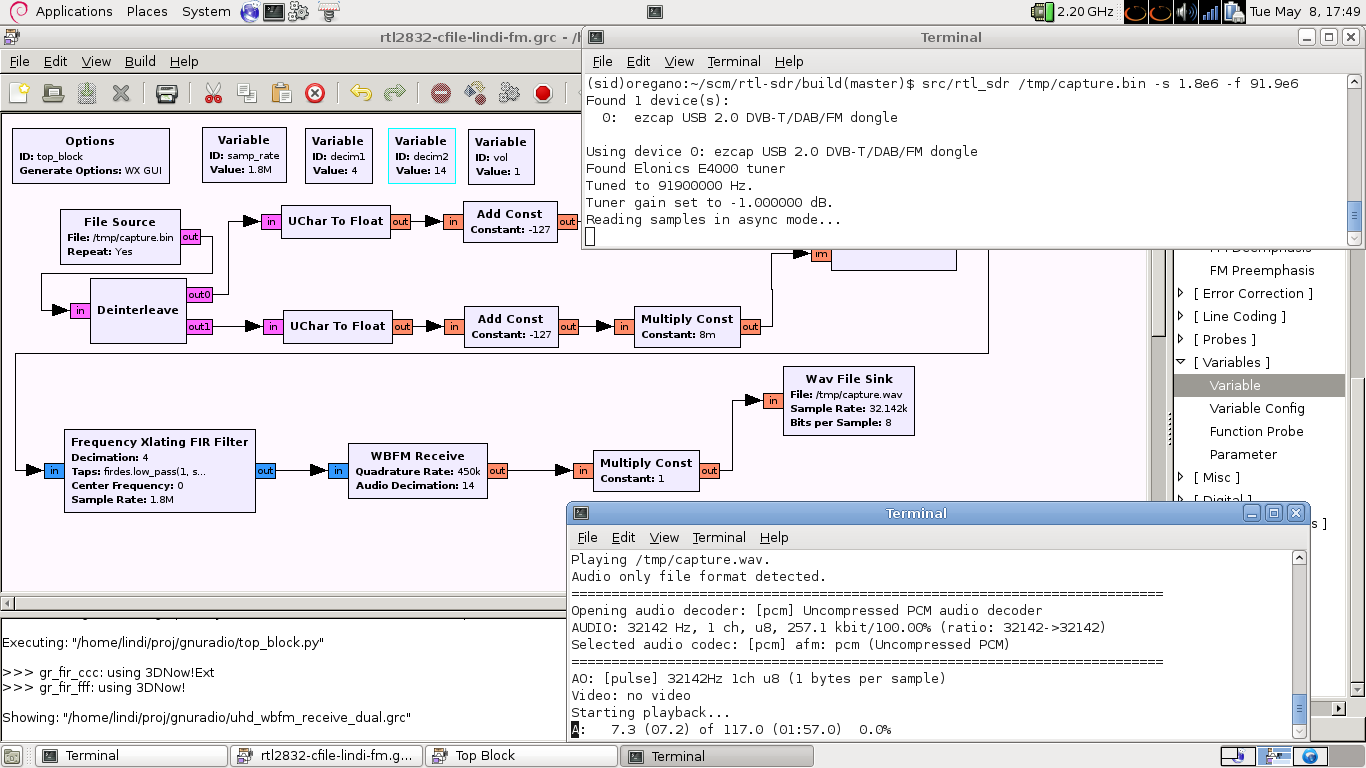 Modified: http://superkuh.com/rtl2832-cfile-lindi-fm_edit.grc , had a frontend GUI and an increased sample rate. Right now the rate of the audio files saved out is... not very useful. But it sounds fine. Seen below.
3.2 MS/s field of view, tune +-900Khz
Modified: http://superkuh.com/rtl2832-cfile-lindi-fm_edit.grc , had a frontend GUI and an increased sample rate. Right now the rate of the audio files saved out is... not very useful. But it sounds fine. Seen below.
3.2 MS/s field of view, tune +-900Khz

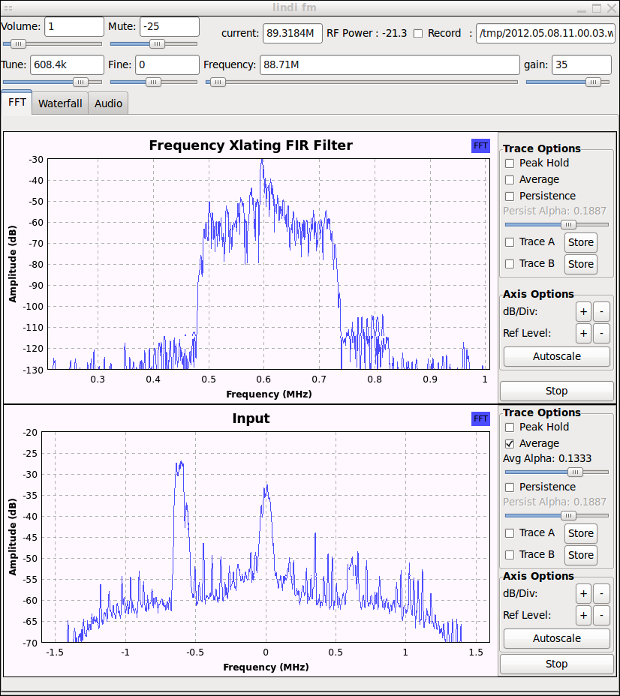
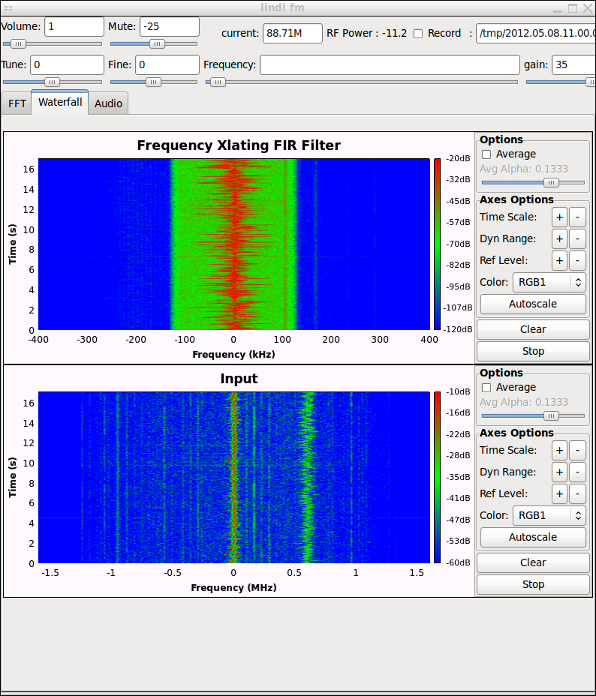
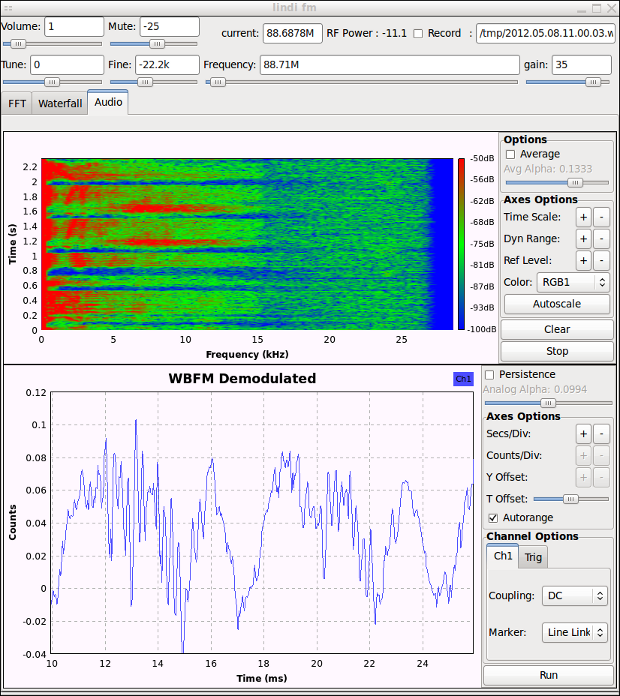
2h20's simple fm receiver
2.8 MS/s field of view, no fine tuning. 2h20 made available, with thorough explaination, a bare bones FM (mono) receiver to learn how to use GNU Radio. This was the first one I managed to get to work. Because the original h202's uses the RTL2832 Source and not the OsmoSDR Source you might experience tuner crashes if you scan too quickly. Make sure to un/replug in the dongle after these. It's best just to enter the frequency as a number. [Be aware this section of this page was written many months ago when rtl-sdr was different and I had little idea of what I was doing. xzero has since manually added signal seeking to this example.] My edit of 2h20's simple receiver does not add much, but I did replace the RTL2832 source with an OsmoSDR source to avoid tuner crashes. I also increased the sample rate to 2.8MS/s (to see more spectrum) and then increased the decimation in the filter from 4 to 8 to compensate so everything still decodes/sounds right. I also remove the superfluous throttle block.

my offset tuning + recording example
2.8 MS/s field of view, +-900Khz tuning, +-50Khz fine. This takes parts from a bunch of the other example receivers and repurposes them in presumably incorrect but seemingly working ways. It is a basic example of how to offset the tuner 200khz away from the center to avoid the noise there. I started with 2h20's simple tuner's GUI framework and removed almost all of the content. I copied, with inaccurate trial and error changes of sample rate and filter offset, sections of the offset tuning and other advanced bits from simple_fm_rcv and wfm_rx.grc. The tuner is tuned +200Khz. The freq_xlating filter is tuned +200Khz. The the bandpass filter is specified in a variable,firdes.complex_band_pass(1.0,1.024e6,-95e3,95e3,45e3,firdes.WIN_HAMMING,6.76)The net result is that the frequency of interest comes out of the tuner 200Khz below DC, and the freq_xlater "lifts it up" by 200Khz, and then it's bandpassed.
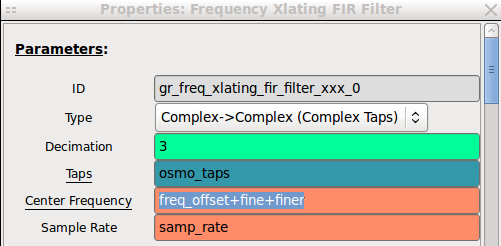 I also blindly copied the RF power display, a toggle for saving the audio files out to disk, and a +-900khz tuning slider from other receivers. I added a second 'fine' tune +-50Khz. This is done by setting the frequency of the Xlating FIR filter to,
freq_offset+fine+finerwhere freq_offset is the frequency offset from center (200Khz in this case), fine is the ID of a wx gui slider for regular tuning, and finer is the same for fine tuning. In order for the frequency display to show the proper value it was correspondingly set to a variable ID cur_freq,
frequency-fine-finer
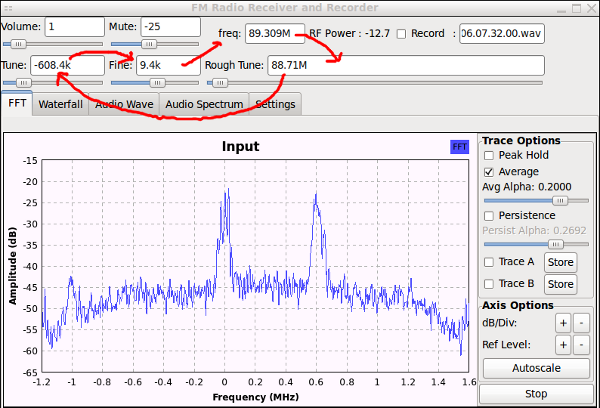 I also made the current frequency display a editable text field so you can tune, copy, and paste. There are good examples of how notebook positioning works and includes simple scripting examples for the file field. This flowchart is simple enough to learn from but includes many elements pulled out of the very complex simple_fm_rcv from patchvonbraun. Without his explanation of the offset process I wouldn't have figured it out. All blocks are layed out by type and GUI elements in the same order as they appear when run. This should help you figure out Grid and Notebook positioning.
The sound is only "okay". I think the signal is being clipped off at the edges a little bit. I am not sure if it is required to install patchvonbraun's simple_fm_rcv to use this, I do use some of his custom filter stuff.
I also made the current frequency display a editable text field so you can tune, copy, and paste. There are good examples of how notebook positioning works and includes simple scripting examples for the file field. This flowchart is simple enough to learn from but includes many elements pulled out of the very complex simple_fm_rcv from patchvonbraun. Without his explanation of the offset process I wouldn't have figured it out. All blocks are layed out by type and GUI elements in the same order as they appear when run. This should help you figure out Grid and Notebook positioning.
The sound is only "okay". I think the signal is being clipped off at the edges a little bit. I am not sure if it is required to install patchvonbraun's simple_fm_rcv to use this, I do use some of his custom filter stuff.
Usage
Use the Waterfall for scanning through channels. Once located, look at the offset from 0 on the bottom display. Use that to set the tuning (and fine) slider and wiggle it till you get the signal crossing the band in the "Second Filter" top display. Switch to FFT view and look at the bottom "First Filter" display, use tuning and fine tuning to center the peak on the "First Filter" display. Or the other way around. It's personal preference. Ignore the noise you see at higher frequencies (900Mhz) at +0.2Mhz baseband. Although sometimes it gets folded in depending on tuning.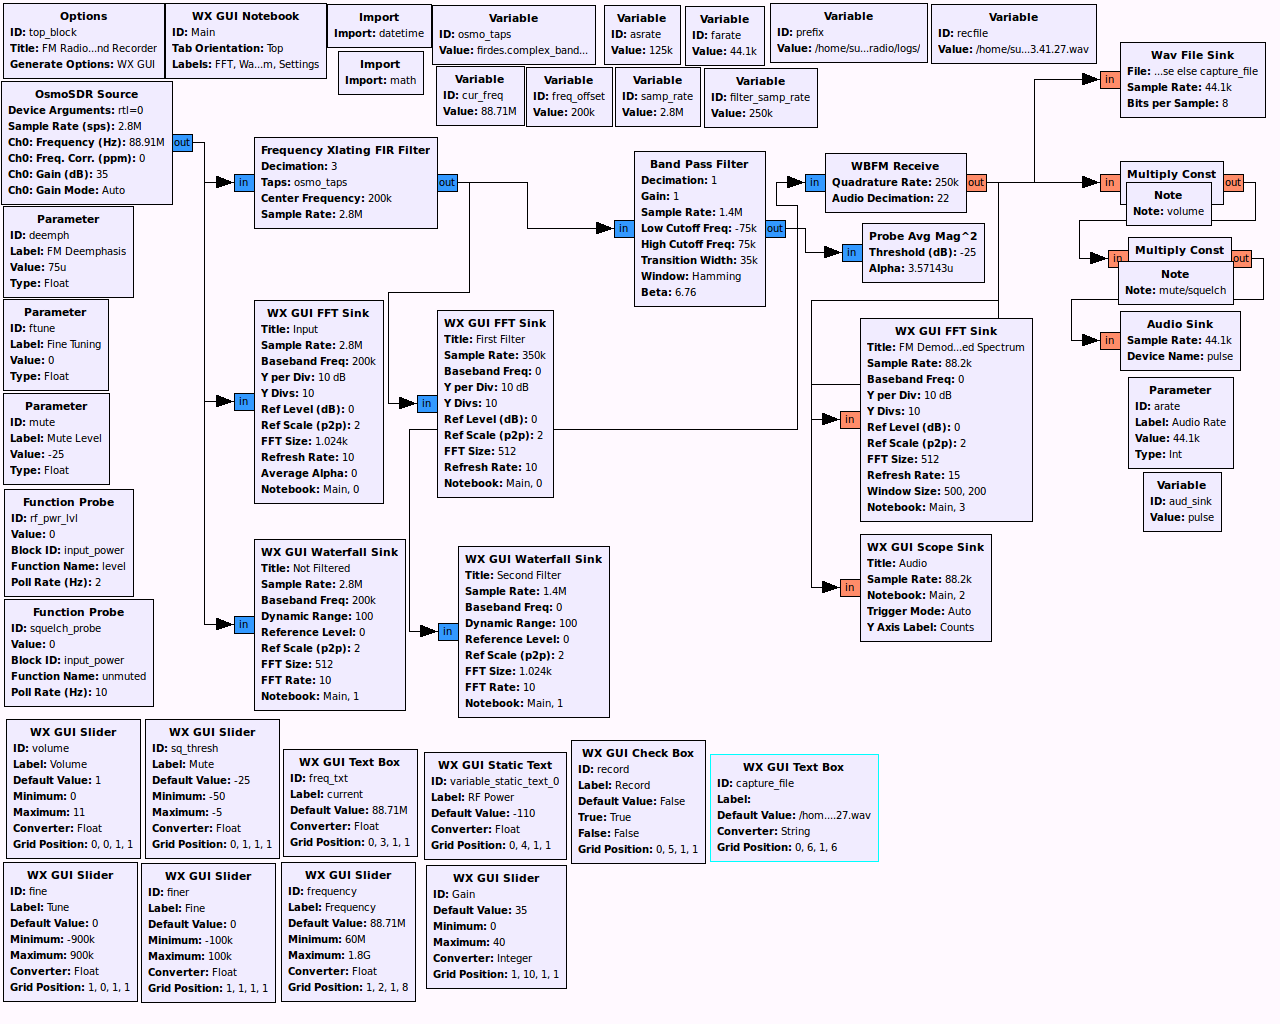
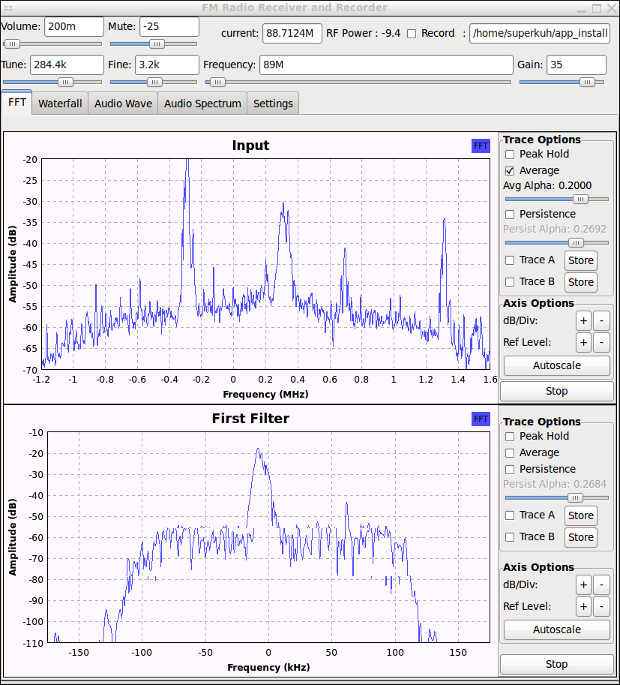

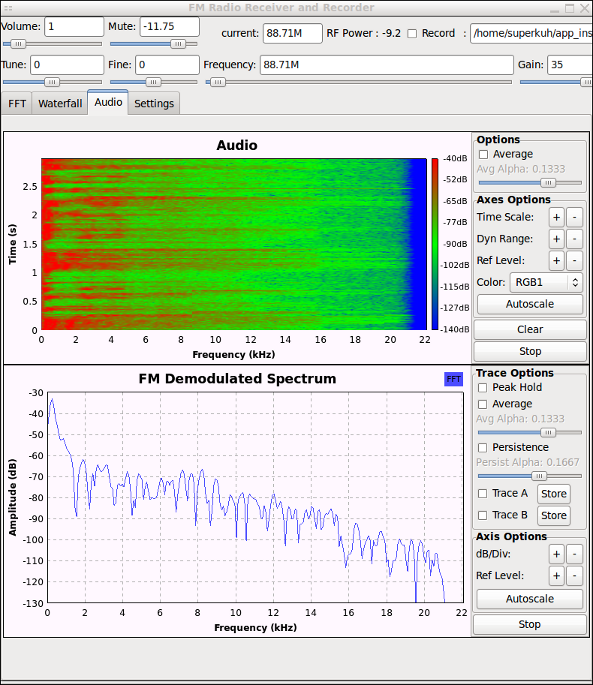
SSB Receiver and data Recorder
Created by Alexandru Csete OZ9AEC the notes say, "Simple SSB receiver prototype". This comes from the GNU Radio GRC examples repository over at https://github.com/csete/gnuradio-grc-examples/tree/master/receivergit clone https://github.com/csete/gnuradio-grc-examples.gitI changed the way it saves samples for the sister decoder program by adding automatic generation of file names and an on/off tickbox toggle for recording. You might want to change the default directory by editing the variable "prefix". The key was
"/dev/null" if record == False else capture_filein the File Sink 'file' field. I also changed the GUI so it was easier to find signals. Use the saved .bin files with ssb_rx_play to hear. Jumping around in frequency is a lot smoother when reading from disk instead of the dongle.
- Modified OZ9AEC SSB Receiver (.grc)
- ssb_rx_play (.grc)

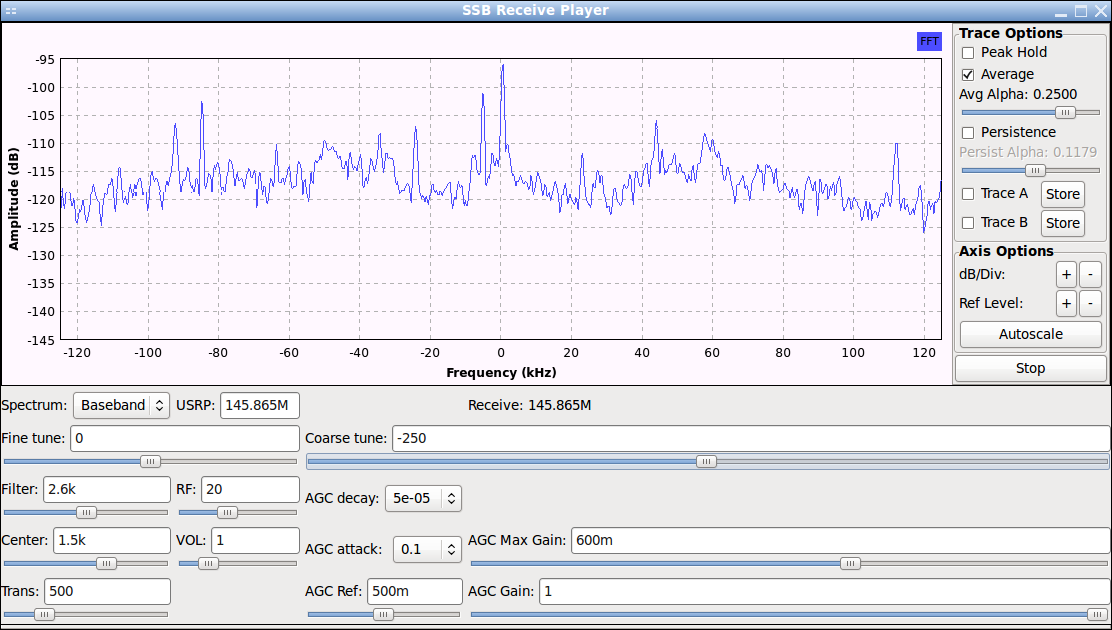
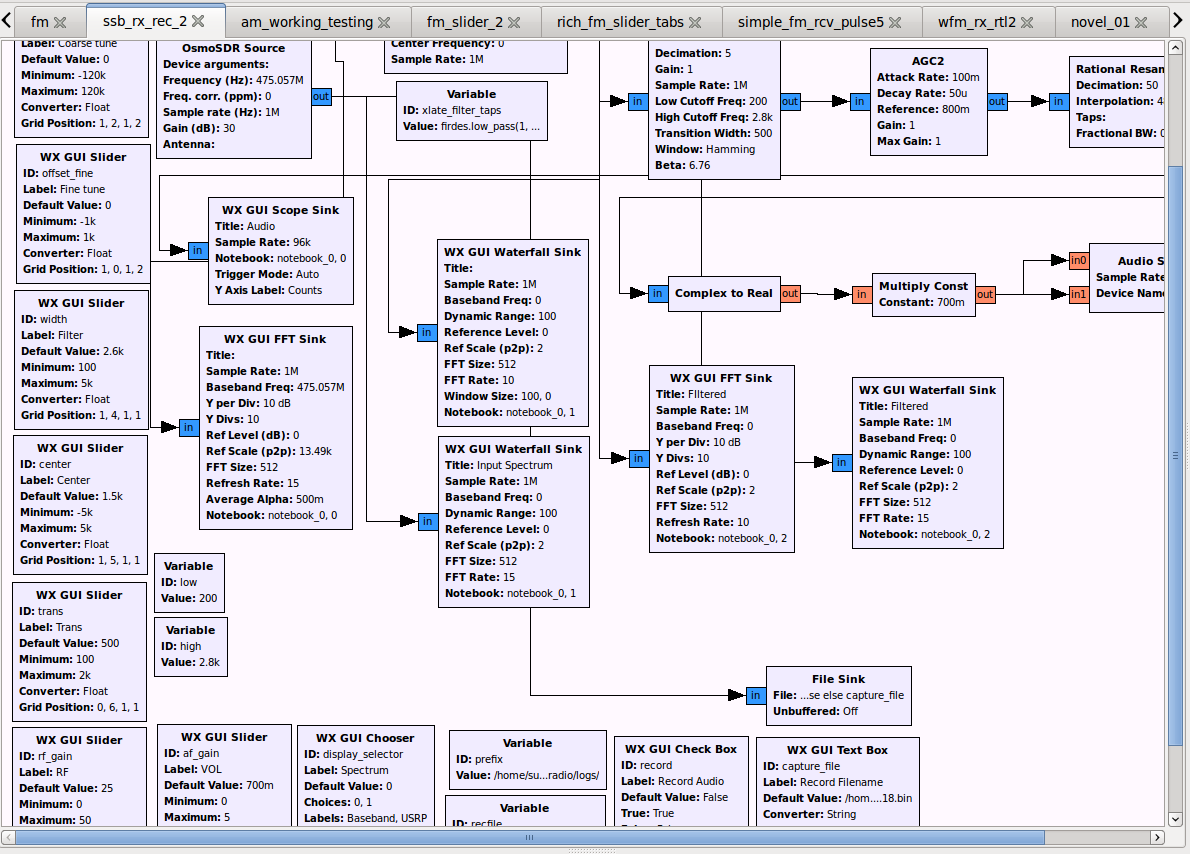
Using External Clocks...
The most exciting development in rtlsdr that has happened recently are Juha Vierinen's discuss-gnuradio mailing list and blog posts about a simple and inexpensive method to distribute the clock signal from one dongle to multiple others for coherent operation. "I recently came up with a trivial hack to build a receiver with multiple coherent channels using the RTL dongles. I do this basically by unsoldering the quartz clock on the slave units and cable the clock from the master RTL dongle to the input of the buffer amplifier (Xtal_in) in the slave units (I've attached some pictures)."- $16 dual-channel coherent digital receiver
- Passive radar with $16 dual coherent channel rtlsdr dongle receiver
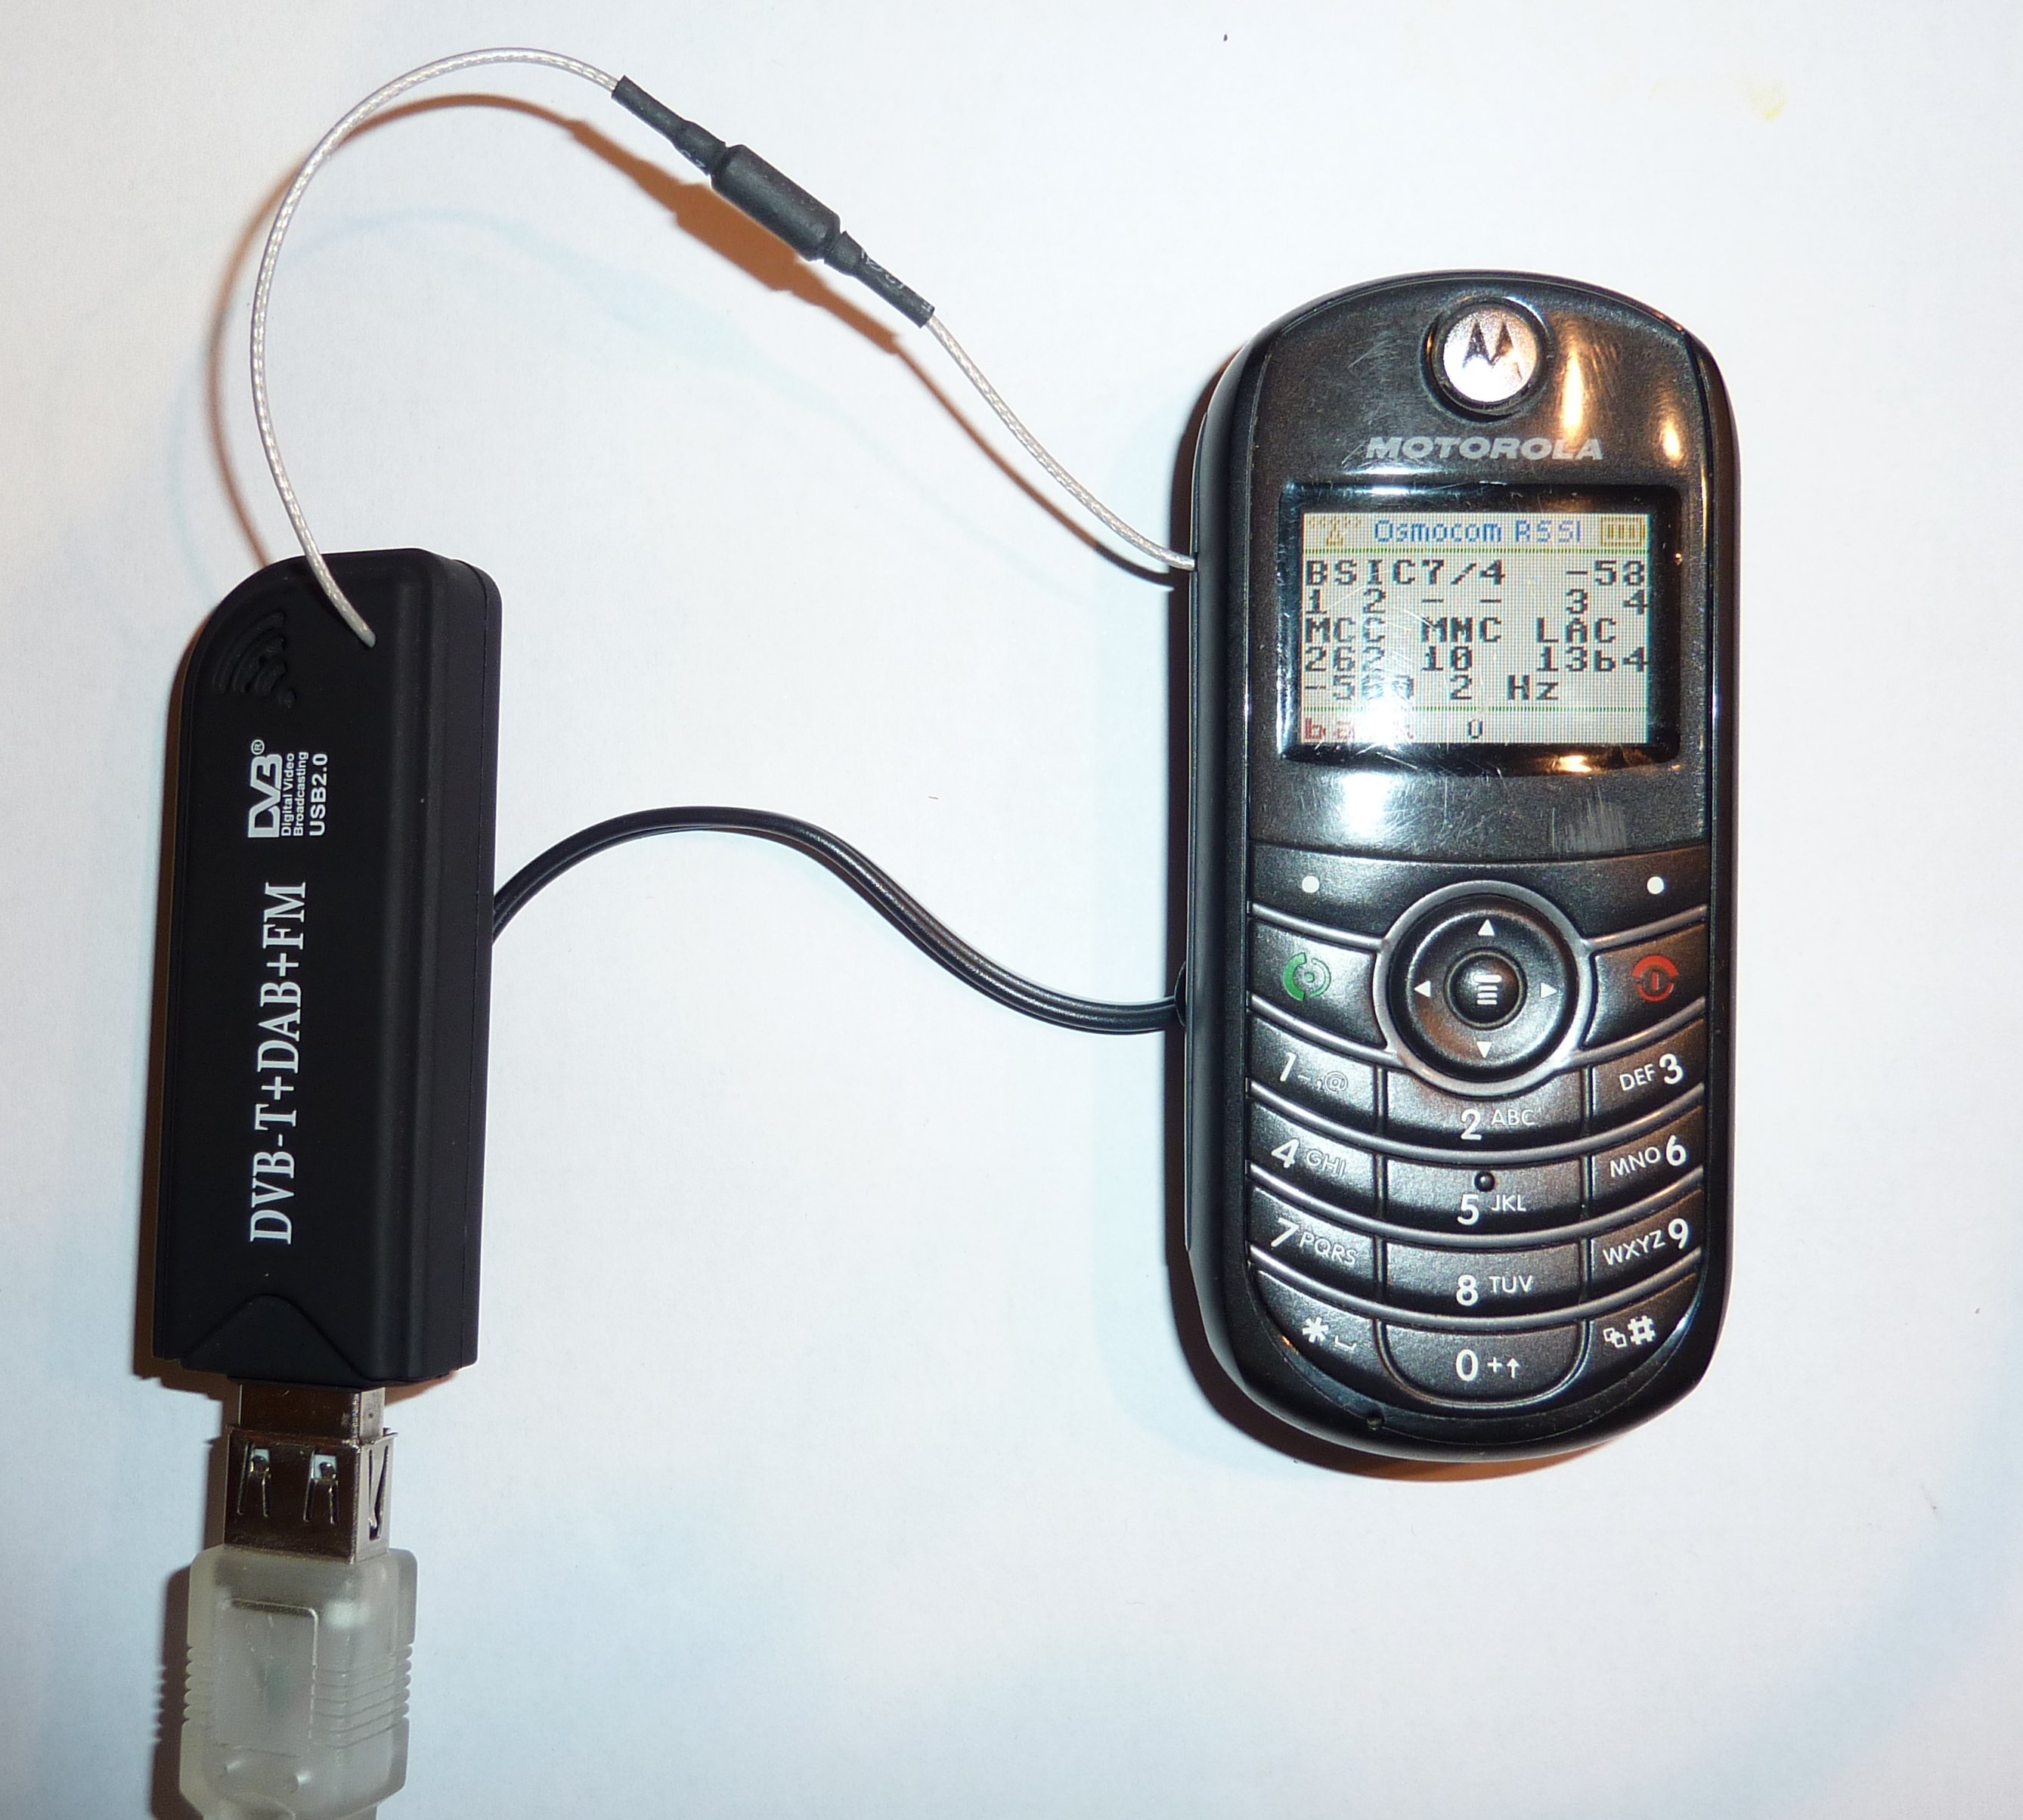
<steve|m> not really, just a picture and a short clip: http://steve-m.de/projects/rtl-sdr/osmocom_clocksource.webm http://steve-m.de/pictures/rtlsdr_external_clock.jpg
<steve|m> a motorola C139
The Green Bay Public Packet Radio guys have written up an interesting article on using 14.4 MHz temperature controlled crystal oscillators sent through a passive (two diode) frequency doubler followed by crystal filters made out of the old rtlsdr clock crystals to provide a low PPM error clock for rtlsdr devices. Since their mirror was missing images I cut them out of the Zine pdf and made a mirror here. I first heard about the GBPPR article from patchvonbraun who implemented one and performed tests which he posted about on the Society for Amateur Radio Astronomy list. It turns out that even with a good distributed clock the 2x R820t rtlsdr dongles still have large phase error for some reason, see: Phase-coherence experiments with RTLSDR dongles and the photo post: Progress towards using RTLSDR dongles for interferometry. Alex Paha has also done clock distribution but unlike the others he used E4000 tuner based receivers for his dual coherent receiver. He also seems to be using only half the I/Q pairs. This post is in Russian. In the absence of any useful information about the RTL2832U clock here's some information about the R820T's clock system. Crystal parallel capacitors are recommended when a default crystal frequency of 16 MHz is implemented. Please contact Rafael Micro application engineering for crystal parallel capacitors using other crystal frequencies. For cost sensitive project, the R820T can share crystal with backend demodulators or baseband ICs to reduce component count. The recommended reference design for crystal loading capacitors and share crystal is shown as below.
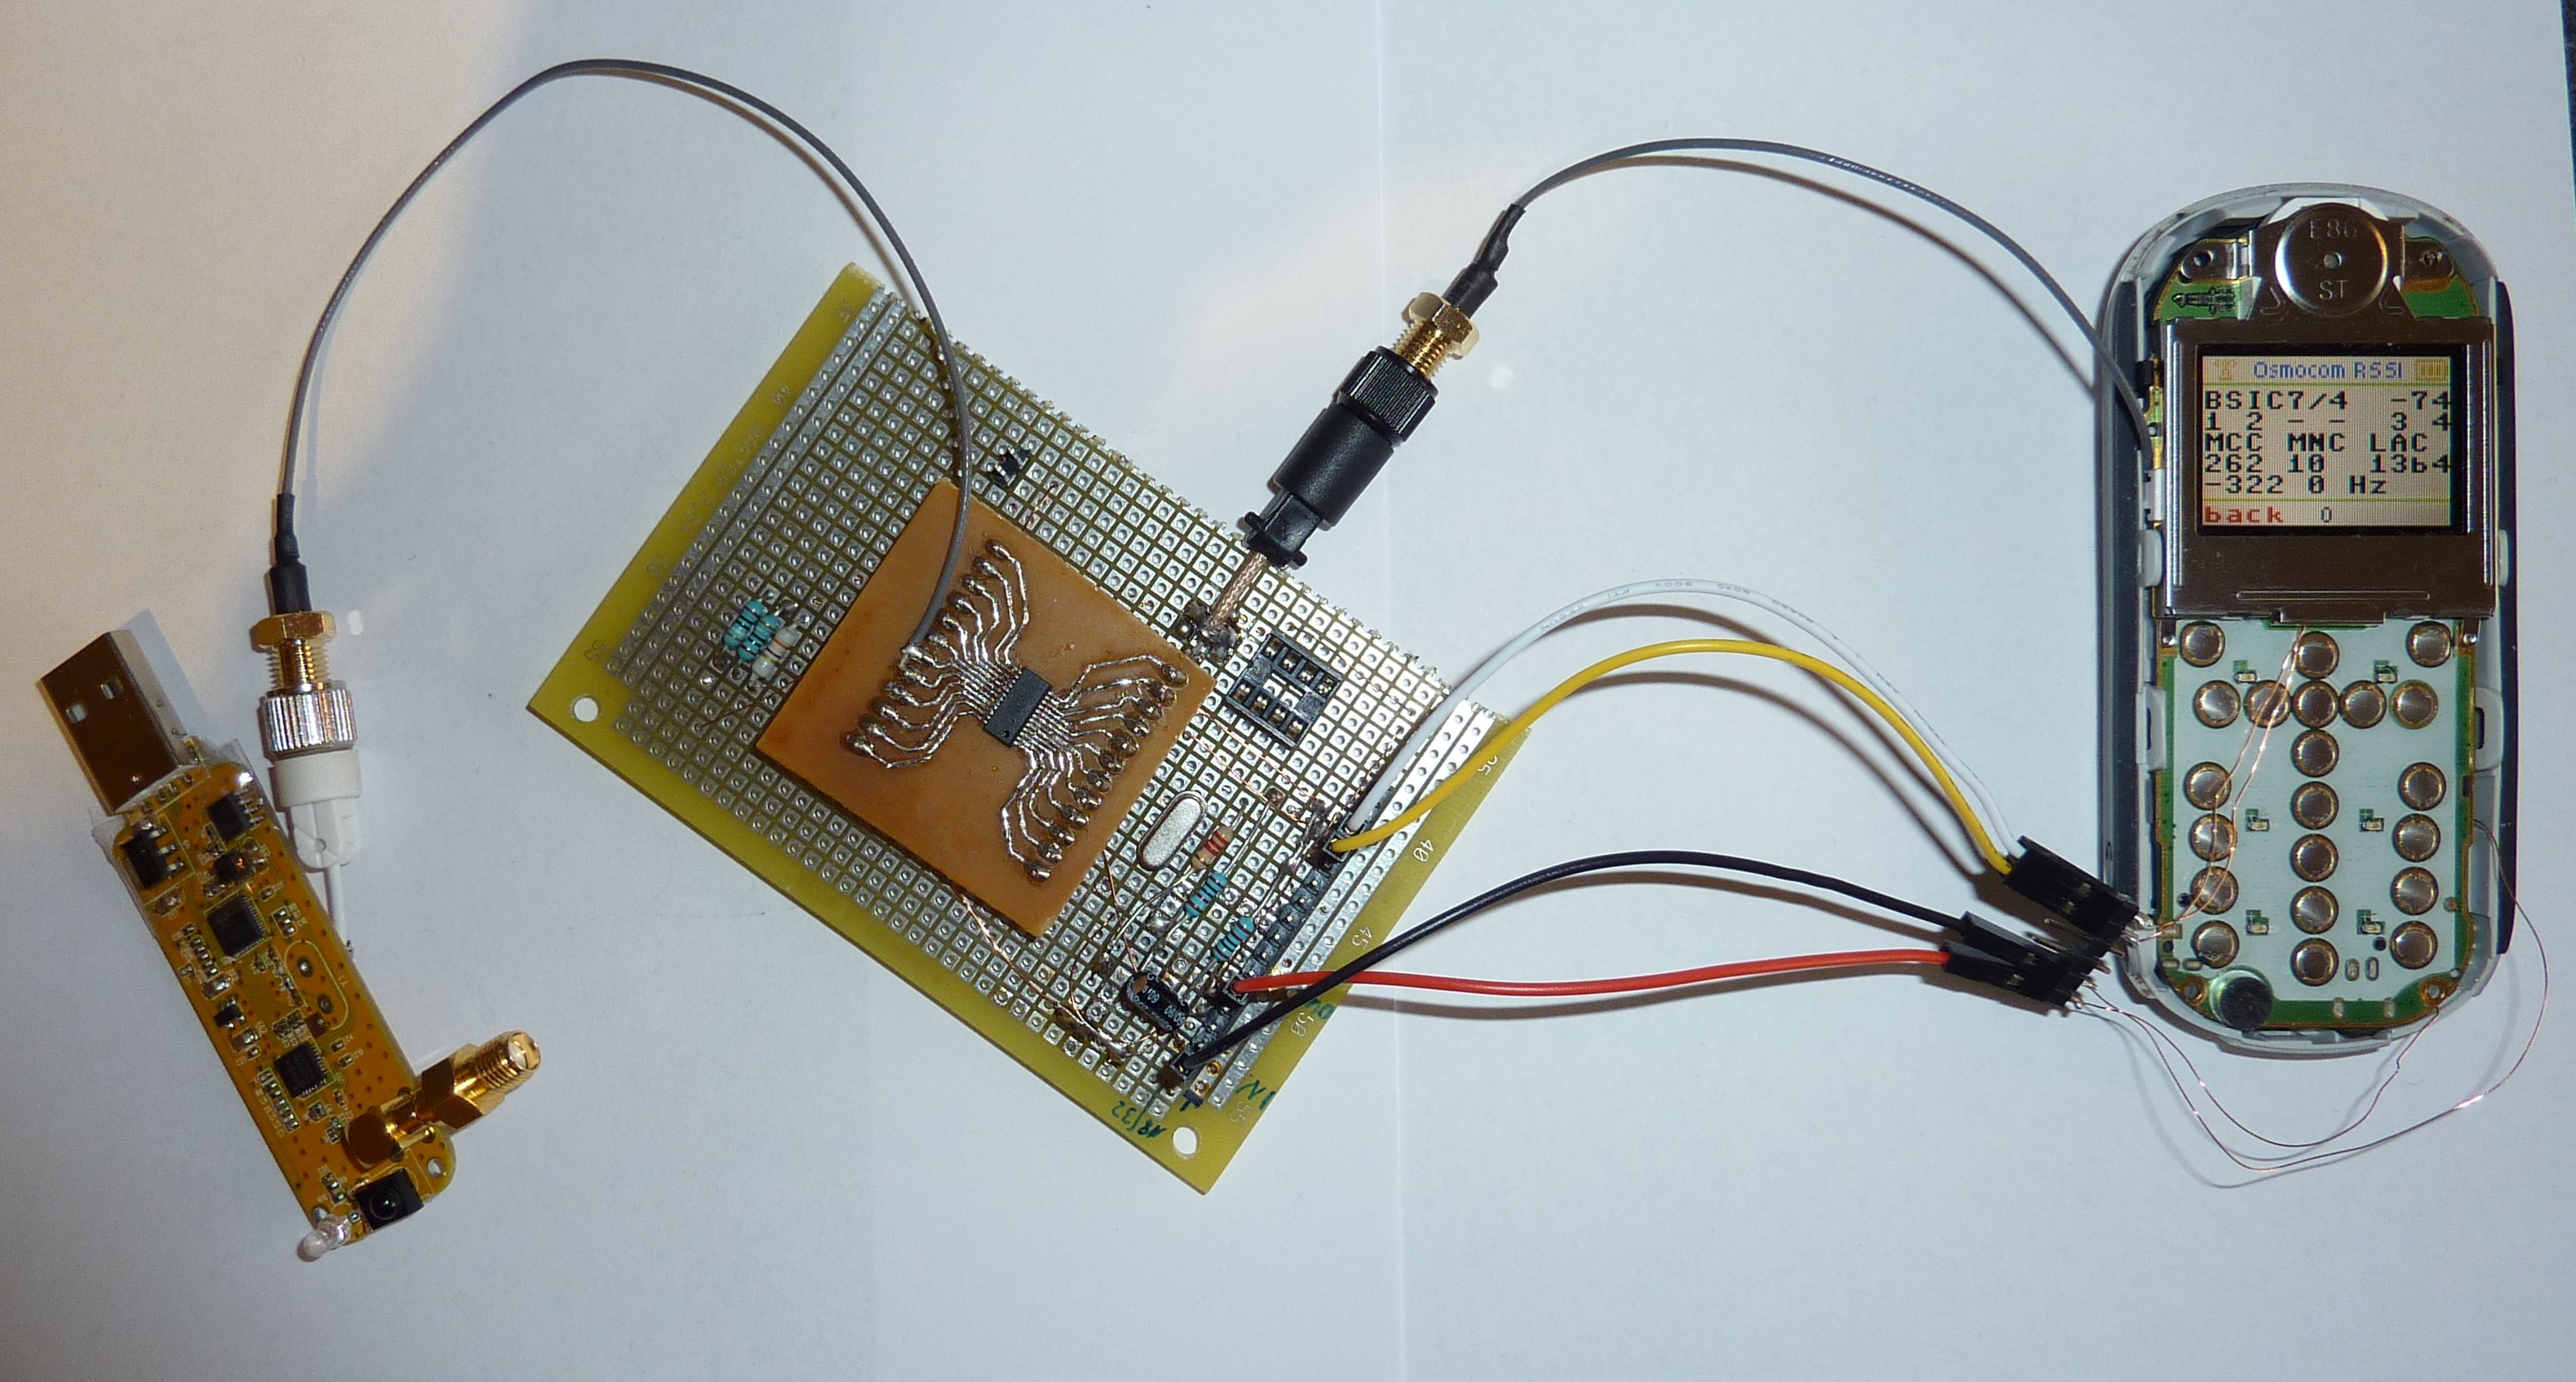
Spectrum Machine...